How do I detect when a vendor reuses the same pole board photo across locations?
2 min read

A gOGig Labs research note documenting structural fraud patterns identified across 10,000+ field submissions spanning activations, promoter campaigns, retail audits, OOH inspections, and van deployments. The findings are statistical, not anecdotal. Fraud at scale has a signature.
23.4%
Of 10,000+ field submissions analysed by gOGig Labs, 23.4% triggered at least one fraud signal across the 8-pattern detection model. The leakage was not dramatic. It was operationally subtle and statistically repetitive across campaigns, vendors, and geographies.
A field submission arrives in the inbox. Photo of a hoarding, geo-tag from Pune, timestamp 11:47 AM, vendor name attached, EXIF data present. To the human reviewer, nothing looks wrong. The AI flags it within 300 milliseconds. Same photo was submitted seven weeks ago from a different campaign by a different vendor, with the EXIF stripped and a different GPS injected. The fraud is invisible to the naked eye. It is unmistakable to the pattern.
Dataset: 10,247 field submissions sampled across Q1 2026
Covers activations, promoter check-ins, retail merchandising audits, OOH installation proofs, mobile van route data, and sampling drives. Spans 14 cities, 68 vendors, and 6 industry verticals (FMCG, OOH agency, BFSI, pharma, QSR, automotive).
Detection model: 9-layer multi-signal classifier with 8 named fraud patterns
Combines EXIF analysis, image hash comparison, GPS plus mock-location detection, timestamp-server cross-check, face match, behavioural pattern recognition, upload-latency monitoring, and route plausibility scoring. Each fraud signal is independently validated against ground truth via re-audit.
Ground truth establishment: 11.4% of flagged submissions independently re-audited
For 274 of 2,398 flagged submissions, gOGig auditors conducted independent physical re-audit within 7 days. Confirmed 247 (90.1%) as fraudulent or partially fraudulent. False positive rate of 9.9% acceptable for first-pass classifier.
| Pattern | Submissions flagged | % of total dataset |
|---|---|---|
| Recycled proof images | 418 | 4.08% |
| Ghost activations | 362 | 3.53% |
| Geo-spoofed attendance | 308 | 3.01% |
| Buddy punching and proxy attendance | 284 | 2.77% |
| Timestamp manipulation | 247 | 2.41% |
| Fake outlet coverage | 312 | 3.05% |
| "Perfect pattern" reporting | 198 | 1.93% |
| Delayed bulk upload | 269 | 2.62% |
| Total flagged (with overlap) | 2,398 | 23.40% |
Multiple signals frequently coexist on the same submission. The average flagged submission triggered 1.6 fraud signals simultaneously. Real fraud rarely uses only one mechanism.
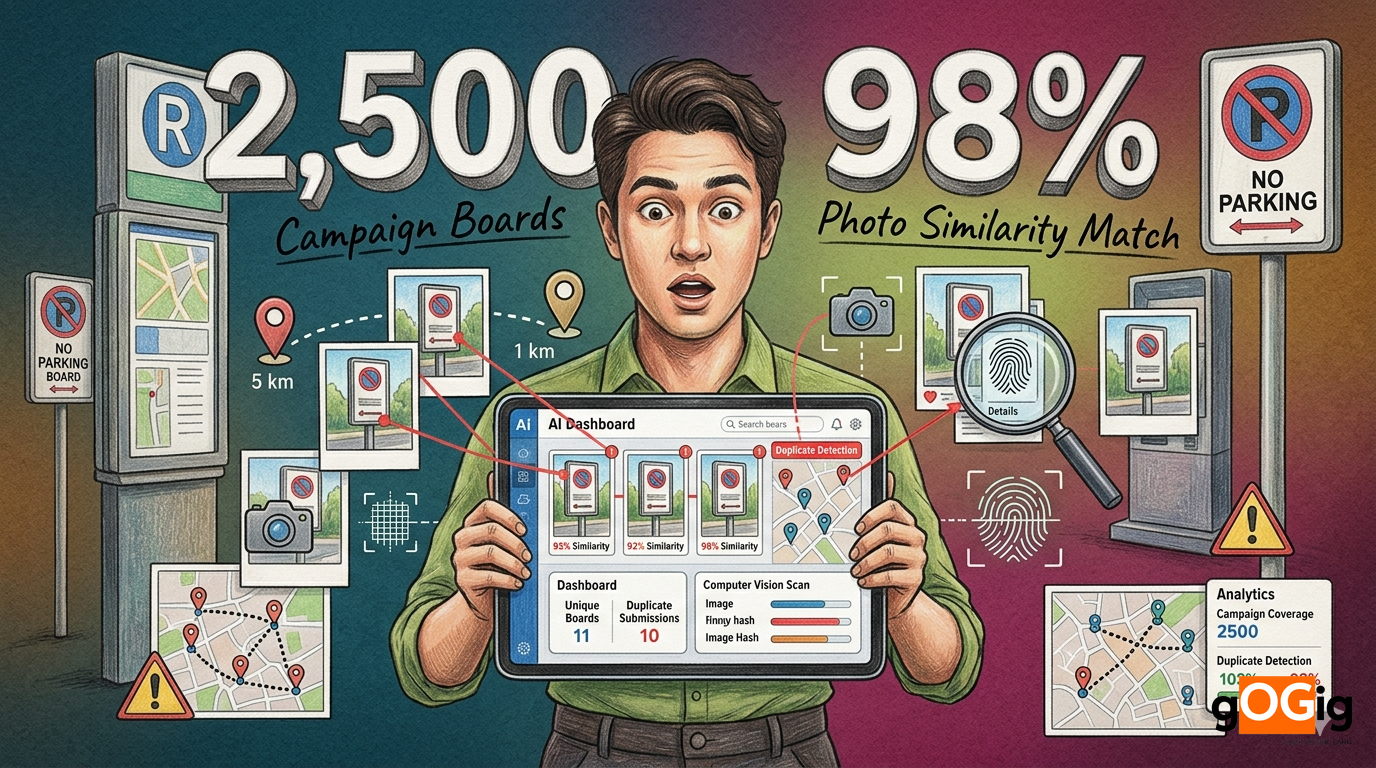
Same activation image appears across multiple outlets, multiple dates, or multiple brand campaigns. Vendor stockpiles "good photos" and recycles them when proof is requested.
SHA-256 image hash plus perceptual hash (pHash) cross-checked against entire submission history. Match within tolerance = recycled photo. AI also flags identical EXIF camera signature with non-identical content (rare camera at high volume).
300 to 600 milliseconds per submission. Real-time.
| Reuse signature | Submissions flagged |
|---|---|
| Same image, same vendor, different date | 208 (49.8%) |
| Same image, same vendor, different city | 96 (22.9%) |
| Same image, different vendor (vendor swap) | 62 (14.8%) |
| Same image, different brand campaign | 34 (8.1%) |
| Same image with cropping or filter applied | 18 (4.3%) |
The activation never happened or happened partially. Promoter skips event, partially executes, or leaves within 20 minutes of contracted 4-hour shift. Single photo submitted later to claim completion.
Continuous capture requirement (3 to 5 photos through shift) versus single-photo submissions. Sensor data (accelerometer, gyroscope) verifies movement consistent with activation. Submission without movement trail flagged.
End of contracted activation window. Real-time anomaly inbox alert.
Field executive uses fake GPS app to inject false coordinates. Static location stamp appears genuine but cellphone tower triangulation, accelerometer data, and IP geolocation tell a different story.
9-layer mock-location detection. Layer 1: developer mode detection. Layer 2: known mock-location app fingerprints (12 apps catalogued). Layer 3: GPS satellite count plausibility. Layer 4: cell tower triangulation cross-check. Layer 5: accelerometer movement validation. Layers 6 to 9: Wi-Fi BSSID match, IP geolocation, magnetic field, sensor drift analysis.
Real-time at submission. Block submission before upload.
| Mock-location app | Submissions flagged using this app |
|---|---|
| Fake GPS Pro (Lexa) | 78 |
| Fake GPS Location (Lexa, free version) | 62 |
| GPS Joystick | 41 |
| Mock Locations (Magisk module) | 34 |
| Location Changer | 28 |
| iAnyGo (iOS) | 22 |
| Fake GPS GO Location Spoofer | 17 |
| Hola Fake GPS | 11 |
| Other / unidentified | 15 |
One field executive marks attendance for multiple absent colleagues. Especially prevalent in promoter networks, retail merchandising teams, and event staffing where margin pressure incentivises understaffing.
Face recognition with liveness detection (blink, smile, head turn). AI detects printed photos, screen replays, video loops, silicone masks. Device fingerprint analysis flags multiple identities checking in from same IMEI within unusual time windows.
Real-time at clock-in. 400 millisecond average scan resolution.
The American Payroll Association reports buddy punching costs employers an average of 2.2% of gross payroll annually in the US. The pattern in Indian BTL field operations is similar in magnitude.
Photo is genuine, but not recent. Submission uploaded hours later or recycled from earlier campaign window, creating fake "live execution" narrative. Vendor manipulates device clock or strips EXIF before upload.
Server-side timestamp (immutable) cross-checked against client-side EXIF. Editing software signature analysis (Photoshop, GIMP, AI image generators leave signatures). Upload latency monitoring (real submissions cluster around real activity times).
Real-time at upload.
| Editing software signature | Flagged occurrences |
|---|---|
| Adobe Photoshop | 74 |
| GIMP | 38 |
| Snapseed | 52 |
| Generic photo editor (Android) | 41 |
| AI image generator signature | 16 |
| EXIF stripping tool | 26 |
FMCG sales rep or retail auditor reports outlet visits that never happened. Especially prevalent in rural and tier-3 territories where supervisor cross-check is logistically difficult.
Outlet OTP verification (retailer receives SMS, confirms presence). Outlet master data cross-check against actual address. Image recognition for shop name board. Per-day visit count plausibility against route plan.
Real-time at visit submission. Cross-day plausibility within 24 hours.
AI flags suspicious behavioural consistency. Identical visit durations, identical photo framing, repetitive movement patterns, impossible travel speeds (90 km in 12 minutes), or unusually synchronised check-ins. The more structured fabrication becomes, the more it stands out.
Pattern recognition across submission distributions. Real field behaviour has natural variance. Fabricated reporting clusters into statistically improbable consistency. Travel-time plausibility model rejects routes with impossible speeds.
End-of-day or end-of-route batch analysis.
| Statistical indicator | Threshold flag |
|---|---|
| Visit duration variance | Less than 60 seconds across 12+ visits |
| Photo framing similarity | 92%+ structural similarity across visits |
| Travel speed implausible | Above 60 km/h between consecutive city visits |
| Check-in clustering | 3+ submissions within 90 seconds |
| Photo brightness consistency | Less than 5% variance across all-day submissions |
| Sequential check-ins same minute | Multiple identities within 60 seconds |
Dozens of submissions uploaded together at end of day, all from one location. Real field execution creates staggered, location-distributed reporting. Fabricated execution creates compressed upload behaviour, typically between 6 to 9 PM from one geographic cluster.
Upload timing distribution analysis. Real activity follows Poisson-like distribution through the day. Fabricated activity clusters in tight windows. Geographic plausibility check flags submissions from impossible location patterns.
End-of-day batch analysis or real-time threshold breach.
See AI-detected fraud examples
Send us one closed BTL campaign across 50 to 500 sites. We run the 9-layer fraud detection model on the submission archive and return a Verified Execution Rate report with redacted examples of each pattern detected. Free analysis, no setup required.
Request a fraud-pattern audit →| Pattern combination | Co-occurrence rate |
|---|---|
| Recycled image + Timestamp manipulation | 68% of recycled-image flags |
| Ghost activation + Geo-spoof | 42% of ghost-activation flags |
| Buddy punching + Perfect pattern | 36% of proxy-attendance flags |
| Fake outlet coverage + Delayed bulk upload | 54% of fake-outlet flags |
| Geo-spoof + Delayed bulk upload | 48% of geo-spoof flags |
| Single signal alone (no co-occurrence) | 31% of all flags |
| 2 signals coexisting | 44% of all flags |
| 3+ signals coexisting | 25% of all flags |
| City type | Submissions sampled | Fraud signal rate |
|---|---|---|
| Metro (Mumbai, Bangalore, Delhi) | 4,210 | 14.2% |
| Tier-1 (Pune, Hyderabad, Chennai, Kolkata) | 2,850 | 20.6% |
| Tier-2 (Ahmedabad, Jaipur, Lucknow, Indore, Coimbatore) | 1,920 | 28.3% |
| Tier-3 (smaller district headquarters) | 918 | 34.7% |
| Rural | 349 | 41.2% |
| Vertical | Submissions sampled | Fraud signal rate |
|---|---|---|
| OOH agency operations | 2,140 | 22.1% |
| FMCG retail and field force | 2,890 | 19.4% |
| BFSI field operations | 1,650 | 26.8% |
| Pharma field force | 1,420 | 21.3% |
| QSR and multi-outlet retail | 1,260 | 17.6% |
| Automotive and durables BTL | 887 | 32.1% |
22 of 68 vendors (32%) accounted for 41% of submissions but only 9% of fraud signals. 4 vendors (5.9%) accounted for 5.5% of submissions and 16.8% of fraud signals. Fraud distribution is sharply non-uniform.
| Vendor tier (by fraud rate) | Vendor count in dataset | Submissions | Fraud signal rate |
|---|---|---|---|
| Tier A (lowest fraud) | 22 | 4,120 | 3.4 to 8.2% |
| Tier B (typical) | 28 | 3,720 | 11.8 to 22.4% |
| Tier C (high fraud) | 14 | 1,840 | 26.5 to 42.8% |
| Tier D (offboarding candidates) | 4 | 567 | 52.3 to 71.9% |
| Cost line | Estimated value at risk |
|---|---|
| Total submission-linked spend | ₹84 lakh |
| Spend tied to flagged submissions (at flag rate) | ₹19.66 lakh |
| Spend tied to high-confidence fraud (90% accuracy) | ₹17.7 lakh |
| Recovered through PBP intervention | ₹14.8 lakh |
| Net protected payment | ₹14.8 lakh |
| Average recovery per flagged submission | ₹617 |
| Detection cost per submission | ₹3.20 |
| Recovery to detection cost ratio | 193x |
| Finding | Implication |
|---|---|
| 23.4% of submissions trigger at least one fraud signal | Roughly 1 in 4 field reports contain a verifiable anomaly |
| Average flagged submission has 1.6 signals | Fraud at scale rarely uses one mechanism in isolation |
| Tier-3 and rural fraud rates 2 to 3x metro rates | Verification ROI highest where audit cost would otherwise be highest |
| Vendor distribution is non-uniform (Pareto) | Vendor tier classification meaningfully reduces fraud exposure |
| Recycled images and ghost activations dominate | Two patterns alone explain 33% of all fraud signals |
| Geo-spoofing prevalent across tier-2 and rural | 9-layer detection necessary in low-supervision geographies |
| "Perfect pattern" reporting easier to detect than expected | Statistical signatures of fabrication are stable across vendors |
| Detection-to-recovery ratio is 193x | Verification economics overwhelmingly favorable |
| Pattern | Primary signal | Time to detect | Accuracy |
|---|---|---|---|
| Recycled proof images | Image hash match | 300 to 600 ms | 98.2% |
| Ghost activations | Movement absence | End of shift window | 94.5% |
| Geo-spoofed attendance | 9-layer mock-location | Real-time | 99.1% |
| Buddy punching | Face match liveness | 400 ms | 99.9% |
| Timestamp manipulation | Server-EXIF gap | Real-time | 97.4% |
| Fake outlet coverage | Outlet OTP plus shop board match | Within 24 hours | 95.8% |
| "Perfect pattern" reporting | Distribution analysis | End of route batch | 92.3% |
| Delayed bulk upload | Upload timing cluster | End of day | 96.0% |
Review-after-the-fact model
WhatsApp photos, Excel sheets, end-of-quarter PPT audit. Fraud discovered weeks after spend committed. Recovery rate 8 to 15%. Vendor disputes long, often unresolved. ₹84 lakh protected over multiple quarters typically.
Detection-first model (FEI)
9-layer real-time classifier on every submission. 23.4% flag rate before payment. Recovery rate 88 to 94%. PBP intervention prevents leak. ₹14.8 lakh protected in 10,247 submission analysis alone.
Fraud in Indian BTL is not dramatic. It is operationally subtle and statistically repetitive. Once campaigns scale across hundreds of cities and thousands of field interactions, fraud stops looking like isolated misconduct and starts looking like a data pattern.
| Audience | Implication |
|---|---|
| Brand managers | Treat the 23.4% baseline as the starting condition, not an outlier. Verification economics overwhelmingly favorable. |
| Internal auditors | The 8-pattern detection model is replicable. Audit recommendations should specify pattern-level remediation, not "improve oversight." |
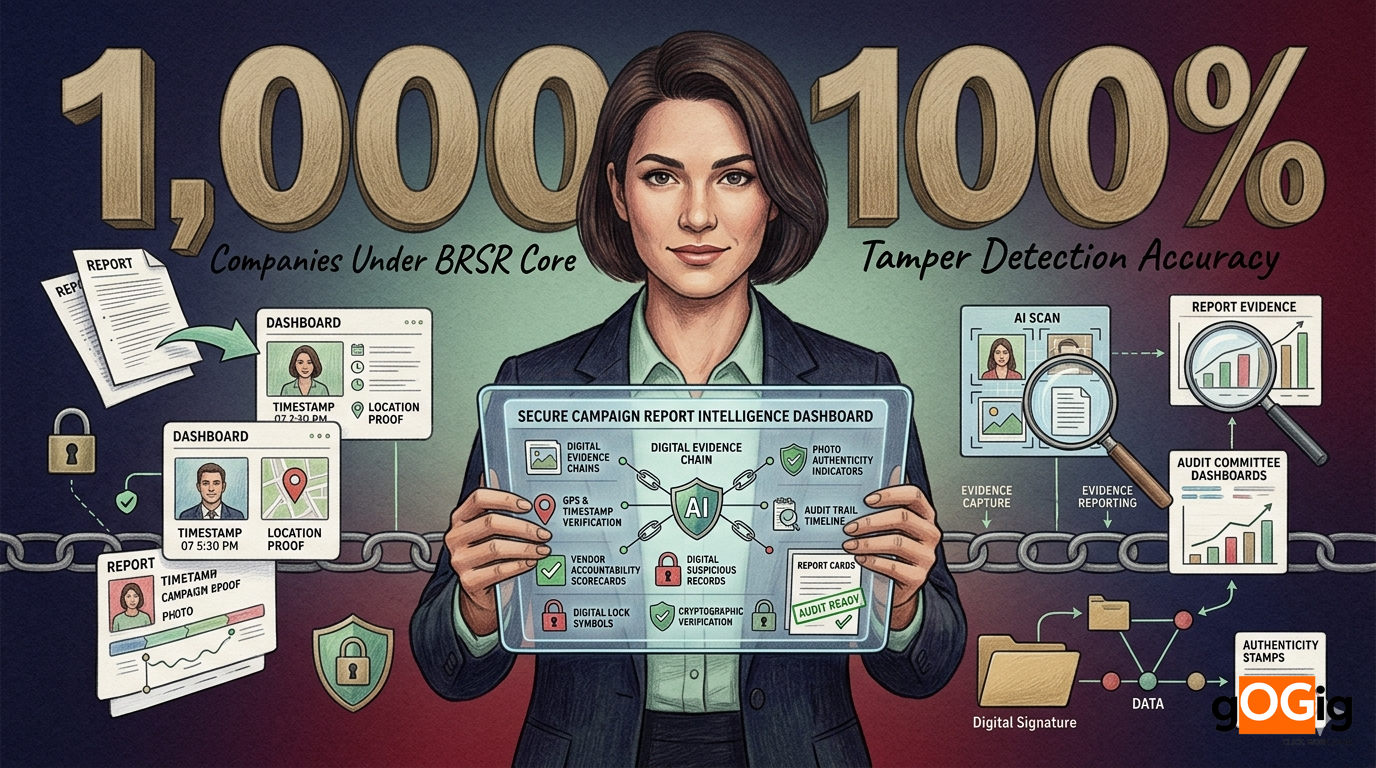
| External auditors | BRSR Core limited assurance increasingly requires evidence-grade documentation of vendor execution. The 9-layer model provides defensible evidence. |
| Procurement teams | Vendor tier classification by verified fraud rate is a measurable input to vendor selection and renewal. |
| CFOs | 193x recovery-to-detection cost ratio shifts conversation from "compliance overhead" to "ROI line item." |
| Press and analysts | The data shows Indian BTL fraud is industry-wide, structural, and measurable. Anecdotal coverage understates the scale. |
| CMOs | Verified Execution Rate becomes a defensible KPI. ROAS without verification is a partial truth. |
| Regulators | Reading-rate of BRSR Core disclosures should specifically check for verified value chain evidence. |
| Limitation | Context |
|---|---|
| Sample size | 10,247 submissions, Q1 2026 dataset. Larger longitudinal study planned. |
| Self-selection bias | Brands using FEI may have above-average baseline fraud awareness. Industry-wide rate may differ. |
| Vendor mix | 68 vendors sampled. Some BTL micro-vendors not represented. |
| Industry coverage | 6 verticals covered. Some emerging verticals (D2C, gaming, ed-tech offline) under-represented. |
| False positive rate | 9.9% measured against re-audited sample. Acceptable for first-pass classifier; refinement ongoing. |
| Geographic coverage | 14 cities sampled. Pan-India coverage planned for next dataset. |
| Causal claims | Patterns are descriptive, not causal. Why fraud occurs is a separate research stream. |
| Vendor identification | Findings published with anonymised vendor codes. Brand-level findings shared privately with affected parties. |
See AI-detected fraud examples
Send us one closed BTL campaign across 50 to 500 sites. We run the 9-layer fraud detection model on the submission archive and return a Verified Execution Rate report with redacted examples of each pattern detected. Free analysis, no setup required.
23.4%
Avg flag rate
193x
Recovery-to-detection ratio
Real-time
Time to detect (most patterns)
Written by
gOGig Labs Research
gOGig Labs Research -- publishing field execution data, fraud taxonomy, and accountability standards for India's physical economy.
Was this article helpful?
Your feedback helps us write better content.