How do I create a tamper-proof campaign report for my CMO in 2026?
2 min read

A practical 2026 fraud detection playbook for OOH planners, BTL agency directors, trade marketing leads, brand managers, and procurement heads commissioning pole kiosks, no-parking boards, and small-format street furniture campaigns at scale. Built around the 7 photo-reuse fraud patterns, image hashing + CV + GPS triangulation, and the network-scale duplicate detection that manual review cannot match.
~20%
Share of pole kiosks, benches, and small-format street furniture in India's total OOH advertising industry. The format with the highest installation volume, the lowest per-asset cost, and the highest fraud exposure. Brands routinely commission 500-5,000+ pole boards per campaign. The visual sameness of poles makes photo reuse fraud easier to hide and harder for human review to catch.
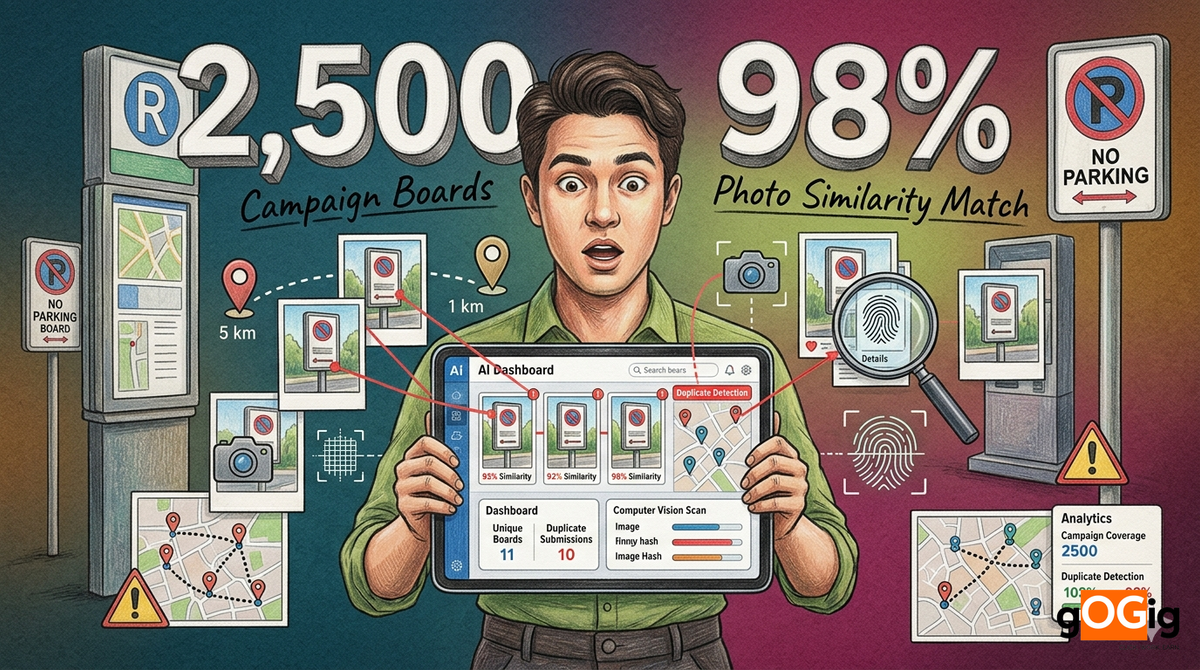
A consumer-tech brand commissions a 2,500-pole board campaign across Bangalore, Hyderabad, and Chennai. ₹18 L budget. The vendor invoices 2,480 boards installed within 6 days. Each board comes with one photo + GPS coordinate + timestamp. The trade marketing head opens the submission folder. 2,480 photos. He scrolls. Every pole looks similar. Same shape. Same height. Same green-grey paint. Same brand poster format. He picks 30 photos at random and runs them through a perceptual hash check. 8 of 30 match other photos in the campaign with 92-98% similarity, even though their GPS coordinates are 4-12 km apart. The vendor took photos of the same boards from slightly different angles, after walking a few meters, after rotating the camera. To a human reviewer the photos looked like different boards. To AI, they were the same physical asset photographed 3-5 times and submitted as 3-5 separate locations. Multiply that across 2,480 submissions and the campaign coverage is closer to 1,700-1,900 actual boards.
| Vulnerability factor | Why it makes fraud easier |
|---|---|
| Visual sameness across all poles | Every pole looks similar; human reviewers cannot distinguish unique assets |
| High volume per campaign | 500-5,000 boards means 1,500-15,000 photos to review |
| Low per-asset cost (₹250-1,200) | Brands tolerate higher unit fraud than for premium hoardings |
| Short installation timeline (3-10 days) | Vendor under pressure; cuts corners to meet deadline |
| Photo similarity makes manual catching impossible | Sample audit hit rate <2% on near-duplicate detection |
| Geographic spread across 8-50 cities | Brand cannot physically verify in person |
| Local printers, casual labour, fragmented vendor ecosystem | Lower process maturity; informal accountability |
| Reused for adjacent / similar campaigns | Old campaign photos recycled into new submissions |
| Hyper-local visibility makes site swaps invisible | Brand cannot drive past every site to verify |
| WhatsApp / Excel submission workflow dominant | EXIF stripped, timestamps lost, geolocation removed |
Exact duplicate (lazy fraud)
Same photo submitted multiple times with different location IDs. Catchable by SHA-256 hash on every photo. Found in low-skill vendor submissions.
8-14%
of submissions
Crop + resize + rotate (modified duplicate)
Same photo modified by cropping edges, resizing, rotating 5-15 degrees. SHA-256 misses; perceptual hash catches it. Most common form of evasion.
14-24%
of submissions
Same pole, multiple angles (visual variation)
Vendor walks 5-10 meters around the same physical pole, captures from 3-5 angles, submits each as a separate board location. CV scene-matching detects it.
12-22%
of submissions
Same pole, different times of day (temporal evasion)
Photos of same board captured morning, noon, evening. Different lighting fools simple hash checks. CV background analysis catches structural sameness.
8-16%
of submissions
Historical campaign recycling
Photos from earlier campaigns reused for new ones. Brand poster may be the same template; vendor swaps in fresh GPS / timestamp. Cross-campaign hash database catches it.
6-12%
of submissions
Cross-vendor photo theft
Vendor A copies vendor B's photos and submits under different campaign. Network-wide cross-vendor hash matching catches it.
3-8%
of submissions
Staged install (install + photograph + remove)
Board temporarily installed, photographed, immediately removed and reused at next location. Photo is real; installation is not. 30 / 60 / 90 day re-audit catches it.
4-10%
of submissions
| Campaign parameter | Typical 5-city pole board campaign |
|---|---|
| Boards installed | 2,500 |
| Photos per board (install proof + 30/60 day audit) | 3-5 |
| Total photos to review | 7,500-12,500 |
| Cities covered | 3-12 |
| Vendors deployed | 3-8 (multi-vendor common) |
| Avg per-board cost | ₹250-1,200 |
| Total campaign budget | ₹6 L - ₹30 L |
| Manual photo review time (5 sec per photo) | 10-17 hours pure review |
| Manual fraud detection accuracy | ~2-5% catch rate |
| Avg uncontrolled fraud rate | 14-32% |
| Avg leakage | ₹1.5-9.5 L per campaign |
SHA-256 image fingerprinting (exact duplicate catch)
256-bit cryptographic fingerprint of every photo. Any pixel-identical re-upload caught instantly. 100% detection rate on exact duplicates. Every photo at submission gets a SHA-256 hash. Hash compared against the campaign's photo database in real-time. Exact match = exact duplicate. Stored across rolling 12-month archive to also catch cross-campaign reuse.
Perceptual hash (pHash) for near-duplicate detection
Identifies the same image after crop, resize, rotate, brightness change, compression, JPEG re-save. Algorithms (pHash, dHash, wHash) generate fingerprints stable across mild transformations. Hamming distance comparison catches modified versions. Threshold tuning: 0-10 = duplicate; 11-15 = near-duplicate (flag for review); 16+ = unique.
CV scene-matching (same physical pole, different angles)
CNN-based scene similarity catches the same pole photographed from different angles, distances, or times of day. Computer vision identifies: pole structure, surrounding buildings, shop signage, road markings, trees, traffic signals, electrical fixtures. Cross-references the constellation of features. Same scene = probable duplicate even if image hash differs.
GPS coordinate triangulation
Two photos with high visual similarity but GPS coordinates 4-12 km apart = strong fraud signal. Cross-reference GPS coordinates between visually similar submissions. Catches "different location" claims for same physical asset. Within-radius poles get higher similarity threshold (10m); cross-zone poles get lower threshold (<2km flagged).
Timeline analysis (travel feasibility)
Vendor reports installation of 3 boards 12 km apart within 4 minutes. Physically impossible. Auto-flagged. Continuous GPS trail per worker. Travel-time feasibility benchmarked against urban / suburban traffic. Impossible install sequences (3+ km in <8 min during day) trigger review. Per-day routing reconstruction catches batch-staged submissions.
Historical hash matching (cross-campaign reuse)
Photos from 2025 campaigns reappearing in 2026 submissions. Detected by 12-month rolling hash database. Every photo's hash stored in a rolling archive (typical 12-18 months). New submissions compared against historical pool. Cross-vendor + cross-campaign + cross-brand matching available within the FEI network.
Live-capture enforcement (prevention layer)
Gallery uploads disabled at app level. Photos must originate from camera at moment of capture. Eliminates the source of most reuse fraud. App-level capture restriction. Camera-only mode. EXIF preserved including device + time + GPS at capture. Photos from gallery, downloaded, or pre-saved cannot be submitted. Reduces fraud upstream before detection layer runs.
Catch every duplicate. Across every pole. In every city.
Free 30-Day Verification Challenge on one pole board campaign. SHA-256 + perceptual hash + CV scene matching + GPS triangulation + timeline analysis + cross-campaign hash database + live-capture enforcement. 100% verification accuracy. 100% fraud detection rate. Works on top of existing vendor workflow.
Request a pole board pilot →| Time | Board & location | AI flag |
|---|---|---|
| 10:05 AM | Board #PB-1024 — JP Nagar 7th Phase, Bangalore | OK |
| 10:07 AM | Board #PB-1025 — HSR Layout Sector 2, Bangalore (4.8 km away) | IMPOSSIBLE |
| 10:09 AM | Board #PB-1026 — Koramangala 5th Block (3.4 km away) | IMPOSSIBLE |
| 10:11 AM | Board #PB-1027 — BTM Layout 1st Stage (5.1 km away) | IMPOSSIBLE |
| 10:13 AM | Board #PB-1028 — Bommanahalli (6.2 km away) | IMPOSSIBLE |
Five boards. Five locations. Spread across 19 kilometres. Submitted within 8 minutes. AI auto-flags the sequence. Manual review would never catch this in time; the photos look authentic. Mock-location detection runs in parallel.
| Live dashboard metric | Value |
|---|---|
| Campaign | CT_BRAND_POLE_3CITY_Q2 |
| Total boards reported | 2,500 |
| Total photos submitted | 8,124 |
| SHA-256 exact duplicate flags | 112 |
| Perceptual hash near-duplicate flags | 218 |
| CV scene-match duplicate flags | 142 |
| GPS triangulation flags | 86 |
| Timeline impossibility flags | 34 |
| Historical reuse flags (12-month archive) | 48 |
| Mock-location flags | 12 |
| Edit-signature flags | 22 |
| Total fraud-flagged photos | 412 (5.1%) |
| Affected board submissions | 287 (11.5%) |
| Per-vendor fraud breakdown | A: 3.2% | B: 6.4% | C: 22.1% |
| Vendor C status | Tier D — intervention triggered |
| Verified Execution Rate (VER) | 88.5% |
| PBP-approved billing | ₹15.9 L of ₹18 L |
| Pending verification hold | ₹2.1 L |
| Fraud pattern | Manual review catch rate | gOGig AI catch rate |
|---|---|---|
| Exact duplicate (Pattern 01) | 30-50% (when photos placed side-by-side) | 100% (SHA-256) |
| Modified duplicate — crop/resize/rotate (Pattern 02) | 5-12% | 100% (perceptual hash) |
| Same pole, multiple angles (Pattern 03) | 2-6% | 100% (CV scene matching) |
| Same pole, different times of day (Pattern 04) | 1-4% | 100% (CV background analysis) |
| Historical campaign recycling (Pattern 05) | 0% (no historical archive) | 100% (12-18 month hash DB) |
| Cross-vendor photo theft (Pattern 06) | 0% | 100% (network-wide hash) |
| Staged install / install+remove (Pattern 07) | 2-8% (random re-audit) | 100% (30/60/90 day random audit) |
| Mock-location / GPS spoofing | 0% | 100% (9-layer detection) |
| Edit / Photoshop / AI-generated | 1-3% | 100% (edit-signature CV) |
| Time per photo verified | 5-15 sec manual | ~3 sec AI per photo |
| Hamming distance (pHash) | Similarity assessment | System action |
|---|---|---|
| 0-5 | Pixel-identical or near-pixel-identical | Auto-flag as duplicate |
| 6-10 | Very similar (minor crop / resize / brightness) | Auto-flag as duplicate |
| 11-15 | Similar (significant transformation) | Flag for review |
| 16-20 | Somewhat similar (large transformation) | CV scene-match secondary check |
| 21-30 | Different photos of similar subject | GPS + timestamp + identity check |
| 31+ | Different images | Standard verification only |
Pre-2025 workflow (manual)
Vendor installs 2,500 boards over 6 days. Submits 8,124 WhatsApp photos. Brand manager reviews random 200 samples (2.5%). Catches 2-3 obvious duplicates. Approves invoice based on what was checked + vendor's word for the rest. Pays ₹18 L. Actual unique installs likely 1,700-2,000. Fraud loss invisible.
2026 workflow (FEI verification)
Vendor installs boards via gOGig-integrated workflow. Live-capture only. Server timestamps. Geofence + 9-layer mock-location. Every photo hash + perceptual hash + CV scene check. Cross-vendor + cross-campaign reuse detection. Timeline feasibility. Day 30/60/90 random re-audit. PBP workflow approves only verified boards. Vendor sees real-time scorecard. Tier C-D vendors intervened in 24 hours. Brand pays ₹15.9 L on 2,213 verified boards.
| India OOH street furniture indicator | Value |
|---|---|
| India OOH ad spend 2024 | ₹6,500 Cr |
| India OOH ad spend 2026 (estimated) | ~₹8,000 Cr |
| Street furniture share of India OOH | ~20% (₹1,600 Cr) |
| Pole kiosks / pole boards spend (approx) | ₹400-650 Cr |
| No-parking boards spend (approx) | ₹150-300 Cr |
| Bus shelter advertising spend (approx) | ₹250-450 Cr |
| Standard pole kiosk size | 3 ft × 5 ft (15 sq ft) |
| Standard no-parking board size | 2 ft × 1.5 ft (3 sq ft) |
| Avg per-board fabrication cost | ₹120-450 |
| Avg per-board total cost (fab + install + maintenance) | ₹250-1,200 |
| Avg campaign size (FMCG, telecom, BFSI, retail) | 500-5,000 boards |
| Avg uncontrolled fraud rate (industry) | 14-32% |
| Avg verified fraud rate (with FEI) | <3% |
| Top India OOH verification platforms | OOHAudit / Hashbrown, Cheqmate, gOGig, Top Hawks |
| OOH leakage estimate (national audit benchmark) | ₹10+ Cr per major audit; ~₹17,800 avg leakage per asset |
| Hidden cost | Annual impact at typical fraud rate |
|---|---|
| Phantom board billing (Pattern 01 + 02 + 03) | ₹2.4-4.6 L (per ₹18 L campaign) |
| Cross-campaign photo recycling | ₹40,000-1.2 L |
| Staged install / install+remove (Pattern 07) | ₹70,000-1.8 L |
| Cross-vendor photo theft | ₹30,000-90,000 |
| Wrong-location placements counted as compliant | ₹50,000-1.4 L |
| Quality / creative compliance failures undetected | ₹40,000-90,000 |
| Time-of-day visibility gaps | Difficult to monetise |
| Manual review labour (2 marketers × 14 days) | ₹80,000-1.5 L |
| Total invisible leakage per ₹18 L campaign | ₹5.1-12.4 L (28-69%) |
| Campaign size | Verification cost (gOGig) | Avg fraud prevented | Net ROI |
|---|---|---|---|
| 500-board (₹4 L) | ₹15,000-28,000 | ₹1.2-2.5 L | 5-9x |
| 1,500-board (₹12 L) | ₹45,000-85,000 | ₹3.5-7 L | 5-9x |
| 2,500-board (₹18 L) — typical multi-city | ₹75,000-1.4 L | ₹5-12 L | 5-9x |
| 5,000-board (₹35 L) | ₹1.4-2.6 L | ₹10-22 L | 5-10x |
| 15,000-board (₹1 Cr national) | ₹4-7 L | ₹30-60 L | 5-12x |
| Format | Typical campaign size | Photo reuse fraud rate (uncontrolled) |
|---|---|---|
| Pole kiosks (3 ft × 5 ft) | 500-5,000 | 14-32% |
| No-parking boards (2 ft × 1.5 ft) | 1,000-10,000 | 18-38% |
| Bus shelter panels | 200-1,500 | 10-22% |
| Bus body branding | 50-500 | 14-28% |
| Auto-rickshaw branding | 500-3,000 | 16-32% |
| Cab and fleet branding | 200-2,000 | 12-26% |
| Cycle / e-rickshaw branding | 200-1,500 | 18-32% |
| Toll naka / signal pole branding | 50-300 | 10-22% |
| Wall mural panels (small format) | 500-3,000 | 14-28% |
| Pole banners / festoons | 200-2,000 | 16-30% |
A photo is not proof. A photo is a claim. The verification layer that turns a claim into proof is hash + scene + GPS + timestamp + identity + history triangulated as a unified system. The brand that asks "did the vendor send photos?" is asking a 2018 question. The brand that asks "can I verify every photo represents a unique board at a unique location during the actual campaign window?" is asking the 2026 question.
Per-board unique asset ID with locked GPS coordinates
9-layer mock-location detection on every GPS
Live-capture photo enforcement (gallery disabled at app level)
Server-side timestamp on every submission
SHA-256 cryptographic fingerprint on every photo
Perceptual hash (pHash + dHash + wHash) for transformation-resilient matching
CV scene matching for same-pole-different-angle detection
GPS triangulation cross-referencing visual similarity
Timeline feasibility analysis for impossible install sequences
Historical hash database (12-18 month rolling archive)
Cross-vendor hash matching within FEI network
Edit-signature detection for Photoshopped + AI-generated images
EXIF metadata preservation across submission pipeline
Worker face-match + Aadhaar identity at app login
30 / 60 / 90 day random re-audit on 10% sample
Per-vendor Tier A+ to D scorecard refreshed real-time
Proof-Before-Payment workflow for 3-way invoice matching
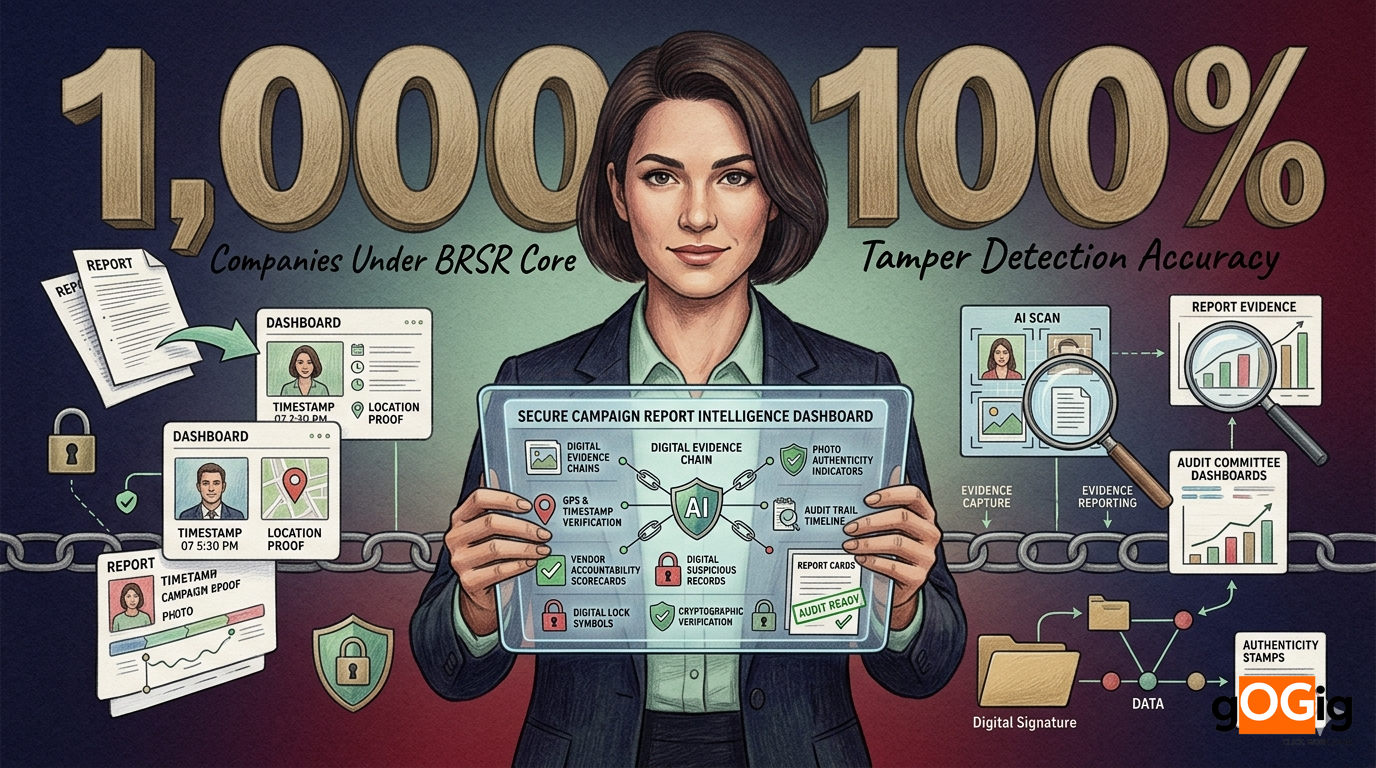
7-year audit-grade retention + BRSR Core-ready evidence pack
Verified by gOGig certification or equivalent independent verification standard
gOGig's hash + scene + GPS + timeline duplicate detection works across every high-volume, visually-similar OOH and street-furniture format.
gOGig's pole board duplicate detection runs across every major Indian metro and tier-1/tier-2 city used in multi-city street-furniture campaigns.
Catch every duplicate. Across every pole. In every city.
Free 30-Day Verification Challenge on one pole board campaign. SHA-256 + perceptual hash + CV scene matching + GPS triangulation + timeline analysis + cross-campaign hash database + live-capture enforcement. 100% verification accuracy. 100% fraud detection rate. Works on top of existing vendor workflow.
100%
AI accuracy
100%
Detection rate
5-12x
Year-1 ROI
Written by
gOGig Editorial Team
The gOGig Editorial team publishes research, frameworks, and field intelligence drawn from gOGig Labs' dataset of 10,000+ verified field submissions across FMCG, dairy, OOH, BTL, pharma, security, telecom, and BFSI sectors.
Was this article helpful?
Your feedback helps us write better content.