How do I detect when a vendor reuses the same pole board photo across locations?
2 min read

A practical 2026 multi-city verification playbook for FMCG sampling heads, BTL agency operations leads, trade marketing directors, brand activation managers, and CMOs running canter, LED van, mobile demo, and roadshow campaigns across 6, 12, or 22 Indian cities simultaneously. Built around the 7-step verification framework, dwell-time-based KPIs, and the AI coverage intelligence model replacing distance-traveled reporting.
~30%
Of BTL budgets are exposed to unverified execution in India, with mobile van campaigns sitting at the high end of vulnerability because brands depend on vendor-reported proof. The single biggest gap in multi-city sampling van tracking is not lack of GPS. It is the gap between "vehicle moved" and "campaign executed". The two are not the same metric.
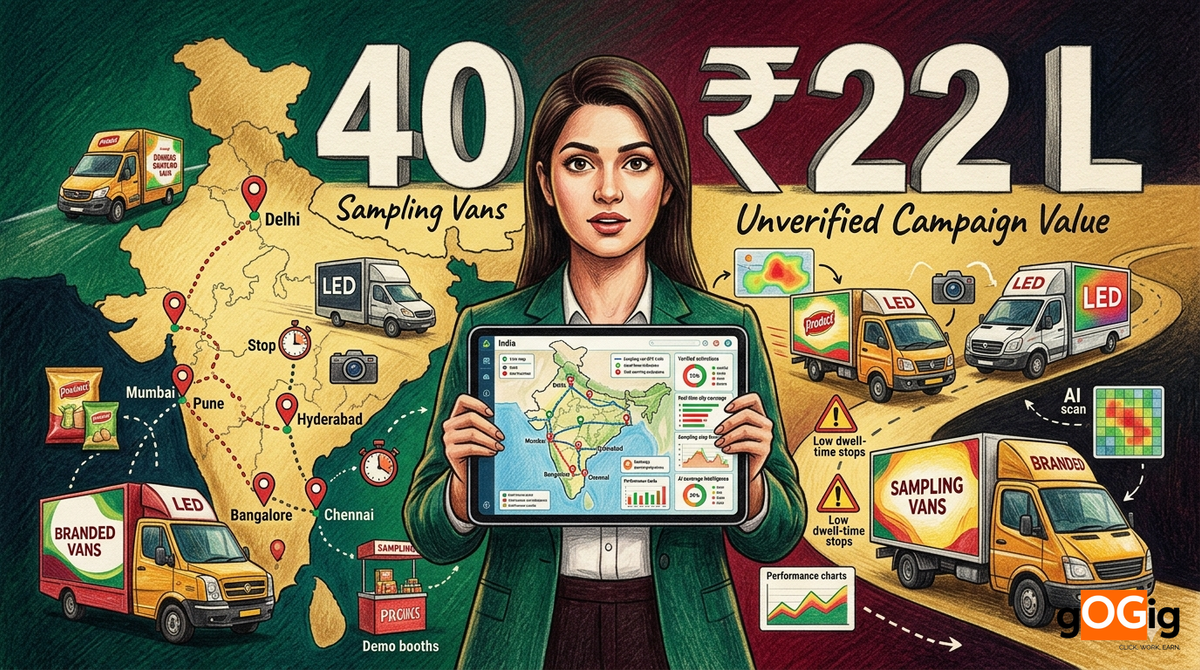
A health-food D2C brand commissions a 12-city sampling van campaign across Bangalore, Mumbai, Delhi NCR, Hyderabad, Chennai, Pune, Kolkata, Ahmedabad, Coimbatore, Surat, Jaipur, and Lucknow. 40 vans. 320 planned stops per day. 20-day campaign. ₹64 L budget. Three weeks in, the marketing director opens the closeout deck. Distance traveled: 84,200 km. Photos submitted: 14,800. Coverage shown: 100%. He decides to test one data point: a Bangalore van claimed 8 stops in HSR Layout one Tuesday. His procurement team pulls the GPS trail. The van entered HSR at 11:42 AM, exited at 12:28 AM. 46 minutes for 8 supposed stops. Average dwell per stop: 5.75 minutes. Inadequate for sampling-quality activation. Across 40 vans for 20 days, a 35% dwell-time deficit translates to ~₹22 L of unverified campaign value. The van moved. The campaign did not happen.
| Campaign attribute | 12-city campaign reality |
|---|---|
| Cities covered | 6-22 |
| Vans deployed | 20-60 |
| Campaign duration | 15-30 days |
| Planned stops per van per day | 6-10 |
| Total planned stops per campaign | 3,600-12,000 |
| Avg dwell per stop (planned) | 30-90 minutes |
| Samples distributed per van per day | 200-500 |
| Total samples per campaign | 1.2-3 lakh |
| Daily distance per van | 40-120 km |
| Total fleet distance per campaign | 32,000-1,40,000 km |
| Avg cost per van per day | ₹4,500-8,000 |
| Avg cost per sample distributed | ₹12-35 |
| Avg campaign cost | ₹25-90 L |
| Manual supervisor capacity | 1 supervisor per 4-8 vans (incomplete) |
| Avg fraud / leakage rate (uncontrolled) | 14-32% |
| Vulnerability factor | Impact |
|---|---|
| Mobile asset across multi-city geography | Distributed supervision impossible at scale |
| City-by-city PPT closeouts | Cross-city fraud invisible in single-city reviews |
| Vendor relationship per city is local | Brand has limited per-city operational visibility |
| Sampling event quality is subjective | "500 samples distributed" hard to verify post-hoc |
| Promoter teams change per city | Identity verification rarely enforced |
| Dwell time as KPI rarely contracted | Vans drive through without engaging consumers |
| End-of-day batch photo upload | Connectivity hides timestamp manipulation |
| Stop locations can be off-target | Van parks 800m from assigned market; counts as covered |
| No cross-day pattern detection | Same shortcut repeated across days unobserved |
| Distance traveled rewarded over engagement | Wrong KPI drives wrong behaviour |
Drive-by fraud
Van enters geofenced zone, drives through without stopping, marks stop complete. Dwell time <2 minutes. No actual sampling.
14-22%
of stops
Short-stop fraud
Van stops in target area but only for 8-12 minutes. Insufficient for quality sampling. Counted as completed in self-report.
18-28%
of stops
Adjacent-location fraud
Van parks 200-600 meters from assigned high-footfall zone. Stops in low-footfall area to save fuel. Counts as covered.
12-18%
of stops
Route skipping
Van covers 5 of 8 assigned stops, claims all 8. Detected through GPS trail vs planned route comparison.
10-16%
of stops
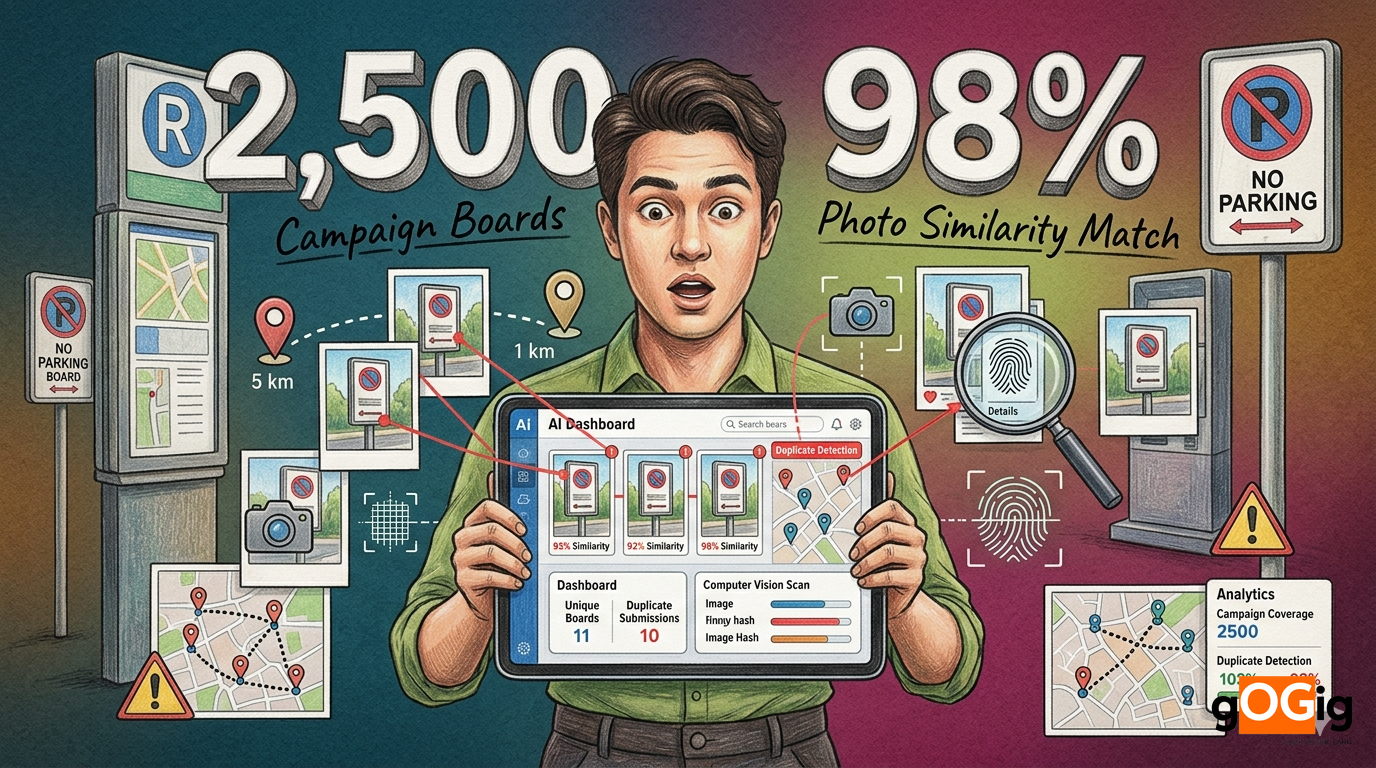
Photo recycling across cities
Same sampling crowd photo used across multiple cities. SHA-256 + perceptual hash detects.
8-14%
of stops
Sample inventory inflation
500 samples claimed distributed; actual count 280. End-of-day inventory variance flags this.
14-24%
of stops
Promoter team substitution
Assigned promoter team replaced by untrained substitutes. Face-match + Aadhaar identity catches.
6-12%
of stops
Idle-time inflation
Van stays parked at one location for 4+ hours, counted as full route. Multiple-stop verification eliminates.
8-14%
of stops
| Metric | Van A | Van B |
|---|---|---|
| Distance traveled (daily) | 82 km | 34 km |
| Stops claimed | 9 | 6 |
| Avg dwell time per stop | 5 min | 42 min |
| Total active engagement time | 45 min | 4 hr 12 min |
| Samples actually distributed | 180 | 620 |
| Conversations recorded | 22 | 208 |
| Footfall zone density | Low (highway) | High (Sunday market) |
| Effective campaign value | Low | Very High |
| Vendor-reported coverage | 100% | 100% |
| Verified Execution Rate (VER) | ~22% | ~94% |
Distance traveled rewards Van A. Verified execution rewards Van B. Brands that contract on distance get Van A behaviour. Brands that contract on dwell-time + verified engagement get Van B behaviour.
Live GPS tracking across the multi-city fleet
Every van continuously transmits location, speed, direction, ignition status. Real-time fleet visibility replaces end-of-campaign PPT.
| GPS layer | What it confirms |
|---|---|
| Live coordinates (10-30s ping) | Current van location |
| Ignition status | Van running vs parked |
| Speed | Driving vs stopped vs idling |
| Direction | Route adherence vs deviation |
| 9-layer mock-location detection | GPS authenticity (spoofing apps caught) |
| Continuous route history | Full day trail recoverable |
| City + zone tagging | Cross-city campaign visibility |
Geofenced activation zones (not just GPS pins)
Pre-mapped polygons around target locations (markets, malls, RWAs, transit hubs). Van entry / exit logged automatically.
| Activation zone type | Typical geofence radius | Why it matters |
|---|---|---|
| Local market / sabzi mandi | 80-150m | Saturday/Sunday high-footfall |
| Mall (entry / parking) | 50-100m | Weekend leisure footfall |
| RWA / residential cluster | 100-200m | Targeted household reach |
| Transit hub (metro, bus stand) | 50-120m | Commuter sampling |
| College campus | 100-200m | Youth segment |
| Tech park / corporate cluster | 50-150m | Office-going professionals |
| Event location | 30-80m | Concentrated audience |
| Hospital / pharmacy zone | 50-100m | Health-focused sampling |
| Religious / community zone | 50-100m | Festival or pilgrimage activation |
| Government event / mela | 100-300m | Mass sampling opportunity |
Measure dwell time, not just coverage
A van that covers 80 km but stops nowhere generates zero campaign value. A van that stays 4 hours at a high-footfall location generates massive value.
| Dwell time | Sampling quality | Verified Execution Rating |
|---|---|---|
| <5 minutes | Effectively a drive-by | Failed (drive-by fraud) |
| 5-15 minutes | Quick stop; minimal sampling | Flagged |
| 15-30 minutes | Light sampling possible | Acceptable |
| 30-60 minutes | Standard sampling event | Verified |
| 60-120 minutes | Quality sampling + engagement | High |
| 120-240 minutes | Premium activation (Sunday market, festival) | Excellent |
Live sampling proof capture (per stop)
Every activation stop generates structured evidence: photos, sample count, promoter check-in, engagement signs.
| Per-stop evidence element | Why it matters |
|---|---|
| Arrival timestamp (server-side) | When the van actually arrived |
| Promoter team face-match check-in | Right team showed up |
| Live setup photo (3-5 photos) | Van + activation setup + signage visible |
| Crowd / engagement photo | Footfall density at the stop |
| Sample-distribution photo | Actual sampling in progress |
| Sample inventory count (pre + post) | Variance = samples distributed |
| Consumer interaction count | Conversations recorded |
| QR scan count (if QR-linked samples) | Trial-to-engagement tracking |
| Departure timestamp (server-side) | Dwell time calculated |
| Per-stop scorecard | Quality grade A+ to D |
Real-time multi-city dashboard for management
Instead of waiting for a 3-day-old PPT, marketing director sees live coverage across all 40 vans in 12 cities at any moment.
| Live dashboard metric | Status |
|---|---|
| Campaign | D2C_HEALTHFOOD_12CITY_MAY |
| Day | Day 14 of 20 |
| Total vans | 40 |
| Active vans (right now) | 37 |
| Idle / on break | 3 |
| Planned stops today | 320 |
| Completed stops today | 218 |
| Verified stops (dwell ≥30 min + photo) | 186 |
| Drive-by flagged stops | 22 |
| Short-stop flagged stops | 10 |
| Adjacent-location flagged stops | 7 |
| Avg dwell time across fleet | 41 min |
| Coverage % (city-weighted) | 90.9% |
| Verified Execution Rate (VER) | 85.3% |
| Samples distributed today | 14,820 |
| QR-scan response rate | 26.4% |
| Cities at risk (>3 flags) | Kolkata, Lucknow |
| Per-van Tier A+ count | 26 of 40 |
| Per-van Tier C-D count | 4 of 40 |
Automated route deviation alerts
Vans skipping zones, taking shortcuts, or idling too long trigger supervisor alerts in real time.
| Deviation type | Auto-alert trigger |
|---|---|
| Skipped stop | Van bypassed assigned geofence within shift window |
| Out-of-route deviation | Van >800m from assigned route for >15 min |
| Excessive idle | Same location for >2 hr without sampling activity |
| Reverse-route movement | Van going wrong direction |
| Mock-location detected | GPS spoofing attempt |
| Promoter team check-in missing | Stop arrived but no team check-in within 5 min |
| Sample inventory mismatch | End-of-day count doesn't match claimed distribution |
| End-of-day batch photo upload | Photos uploaded outside expected timing window |
| Photo recycle (cross-stop) | SHA-256 match against same-day or prior-day photos |
AI coverage intelligence (geographic + audience analysis)
Move from "where did the van go?" to "which audience segments did the campaign actually reach?"
| AI coverage analysis | What it answers |
|---|---|
| Locality coverage heatmap | Which neighbourhoods got campaign visibility |
| Pincode-level dwell time | Per-pincode engagement intensity |
| Footfall efficiency score | Was time spent at high-footfall zones? |
| Demographic exposure estimate | Estimated reach by income, age, gender |
| Coverage gap analysis | Which target pincodes were under-served |
| Cross-city efficiency comparison | Which city executed best per ₹ spent |
| Per-van efficiency ranking | Distance vs dwell vs samples vs engagement |
| Optimal route recommendation | AI-suggested next-campaign route |
| Trial-to-purchase correlation | QR scan + sales data linked to specific stops |
| ROI per pincode | Revenue lift attributable to van activity |
Replace distance reports with verified multi-city coverage
Free 14-day Field Execution Intelligence pilot for FMCG, D2C, healthcare, BFSI, EdTech, and automotive brands running sampling van or canter / LED van / mobile demo campaigns. Live GPS + geofenced activation zones, dwell time verification, live sampling proof capture, AI coverage intelligence, real-time multi-city dashboard, per-van scorecards. 100% verification accuracy. 100% fraud detection rate.
Request a multi-city sampling van pilot →Route intelligence
Route completion vs planned route · Zone coverage by city · Stop verification with geofence + dwell · Cross-city movement patterns · Deviation alerts in real time
Activation intelligence
Sample distribution count (pre vs post inventory) · Dwell time per stop · QR scan response rate · Consumer engagement events · Crowd / footfall density photo evidence
Team intelligence
Promoter team attendance via face-match · Per-promoter performance scorecard · Team movement and handover compliance · Activity compliance per stop · Substitute promoter detection
Executive intelligence
City-level performance ranking · Coverage heatmaps for each city · Missed-zone alerts · Per-pincode ROI visibility · QR-to-sale attribution linkage
Pre-2025 sampling van tracking
Van runs campaign. Driver sends WhatsApp photos at end of day. Excel route summary. PPT submitted weekly. Marketing director sees 3-day-old data. Distance traveled is headline KPI. Coverage % is self-reported. Fraud invisible until post-campaign reconciliation. ₹5-12 L of average leakage absorbed silently.
2026 sampling van tracking
Live GPS, geofenced stops, dwell time enforcement, live sampling photo + sample-count proof, per-promoter face-match, real-time supervisor dashboard, deviation alerts, AI coverage intelligence. Marketing director sees live state of campaign across 40 vans in 12 cities. ₹5-12 L of leakage prevented. ROI math defensible to CFO.
| Use case | Typical scale | Verification stake |
|---|---|---|
| FMCG product launch (national) | 20-60 vans across 8-22 cities | ₹25-90 L; brand recall + trial-to-purchase |
| D2C health / nutrition sampling | 10-30 vans across 4-10 cities | ₹10-40 L; trial conversion via QR |
| Beverage summer / festive campaign | 30-100 vans across 12-24 cities | ₹40-1.5 Cr; volume + visibility |
| Cosmetics + personal care | 15-40 vans across 6-15 cities | ₹15-50 L; demo + sampling combined |
| Automotive test drive roadshow | 8-20 vans across 8-15 cities | ₹20-60 L; test drive lead generation |
| BFSI loan / insurance camp | 20-50 vans across 8-15 cities | ₹25-75 L; lead capture + KYC |
| EdTech / coaching enrolment van | 15-40 vans across 6-12 cities | ₹18-50 L; admission enquiry generation |
| Telecom / DTH activation van | 40-100 vans across 14-22 cities | ₹50-1.5 Cr; SIM / subscription sales |
| Pharma OTC / healthcare | 15-40 vans across 6-12 cities | ₹15-45 L; awareness + diagnostic trial |
| Government / awareness campaign | 50-200 vans across 20+ districts | ₹30 L-2 Cr; voter / scheme awareness |
| Festival / IPL / mega event activation | 20-80 vans across 10-20 cities | ₹30-1.2 Cr; brand experience + recall |
| QSR launch in new city | 4-12 vans per city | ₹8-30 L per city; sampling + outlet drive-to |
| Cost dimension | Annual impact for 12-city, 40-van campaign (₹64 L budget) |
|---|---|
| Drive-by / short-stop leakage | ₹8-14 L (14-22%) |
| Adjacent-location coverage leakage | ₹3-6 L |
| Sample inventory inflation | ₹2-5 L |
| Promoter team substitution | ₹1.5-3 L |
| Manual reconciliation overhead | ₹0.5-1.2 L |
| Wrong-city sample miscount | ₹1-2 L |
| End-of-campaign dispute resolution | ₹0.5-1.5 L |
| Lost ROI from sub-optimal targeting | ₹3-8 L |
| BRSR Core preparation overhead | ₹0.3-0.8 L |
| Total typical leakage on ₹64 L campaign | ₹19-41 L (30-64%) |
| Campaign scale | Verification cost (gOGig) | Avg leakage prevented | Net ROI |
|---|---|---|---|
| 3-city, 10-van canter (₹12 L) | ₹50,000-90,000 | ₹2.5-4 L | 4-8x |
| 6-city, 20-van campaign (₹30 L) | ₹1-1.8 L | ₹6-12 L | 5-10x |
| 12-city, 40-van campaign (₹64 L) | ₹2.5-4 L | ₹15-28 L | 5-12x |
| 22-city, 60-van campaign (₹1.2 Cr) | ₹5-8 L | ₹25-45 L | 5-14x |
| National 100-van campaign (₹2.5 Cr) | ₹9-15 L | ₹50-100 L | 6-15x |
| Per-van KPI | Tier A+ van | Tier C-D van |
|---|---|---|
| Verified Execution Rate (VER) | 92-100% | 62-78% |
| Avg dwell time per stop | 35-90 min | 5-18 min |
| Drive-by flags per week | 0-1 | 4-12 |
| Adjacent-location flags per week | 0-1 | 3-8 |
| Mock-location detections | 0 | 1-4 |
| Sample inventory variance | ±2-5% | ±18-32% |
| QR scan response rate (where applicable) | 22-40% | 6-14% |
| Promoter team face-match pass rate | 100% | 72-88% |
| Photo authenticity rate | 100% | 62-82% |
| Cross-city duplicate flag rate | <1% | 4-12% |
| Renewal probability | ~95% | ~30% |
| Red flag | What it suggests |
|---|---|
| Coverage reports 100% across all cities every day | Statistical impossibility |
| Avg dwell time < 12 min across the campaign | Systemic drive-by fraud |
| Photos consistently uploaded after 9 PM | End-of-day batch fabrication |
| Same crowd photos across multiple cities | Cross-city image re-use |
| Sample inventory variance >20% reported | Sample inflation / understocking fraud |
| Distance traveled rewarded over dwell time | Wrong KPI; rewards wrong behaviour |
| Vendor objects to face-match promoter verification | Substitute promoter risk |
| Vendor resists geofenced stop validation | Wants flexibility to park elsewhere |
| Reports come pre-formatted (templated, identical phrasing) | Cookie-cutter; not data-driven |
| Invoice arrives before final-day campaign closeout | Pre-prepared; not verified |
| Dimension | Manual / WhatsApp / Excel | gOGig pipeline |
|---|---|---|
| Coverage of stops verified | 4-8% sampling | 100% |
| Time per stop verified | 5-15 min manual review | ~3 sec AI |
| Drive-by detection | ~10% | 100% (dwell time analysis) |
| Adjacent-location detection | ~3% | 100% (geofence enforcement) |
| Photo recycling detection | 4-8% | 100% (SHA-256 + perceptual hash) |
| Mock-location detection | ~0% | 100% (9-layer) |
| Promoter substitution detection | ~0% | 100% (face-match CNN) |
| Per-city scorecard refresh | End of campaign | Real-time |
| Per-van scorecard refresh | Monthly | Real-time |
| Per-pincode ROI visibility | Estimated post-hoc | Live |
| QR-scan to sale correlation | Manual stitching | Auto-linked |
| BRSR Core / audit-grade retention | Manual collation | 7-year structured retention |
| Year-1 ROI | Baseline | 4-15x |
In multi-city sampling, the question is not "did the van move?". The real question is "did the planned audience meet the brand, for long enough to register the trial, in the right zone at the right time?". A km of distance is not a unit of marketing. A minute of dwell time at the right location is.
Per-van unique ID (VAN-CITY-NNN) with city + route assignment locked
Live GPS tracking with 10-30 second ping intervals
9-layer mock-location detection on every van
Pre-mapped geofenced activation zones for every stop
Dwell-time KPI (≥30 min) as contractual minimum per stop
Live-capture photo evidence per stop (3-5 photos)
Sample inventory count at start and end of each stop
Promoter team face-match + Aadhaar identity at every stop
QR-linked samples for trial-to-engagement tracking
SHA-256 + perceptual hash on every photo (cross-stop + cross-city)
Real-time multi-city dashboard for marketing director + brand team
Automated deviation alerts for missed stops, adjacent parking, idle violations
Per-van Tier A+ to D scorecard refreshed real-time
Per-city + per-pincode coverage heatmap
Verified Execution Rate (VER) as contractual KPI
Proof-before-payment workflow for invoice 3-way matching
7-year audit-grade retention + BRSR Core-ready evidence pack
Verified by gOGig certification or equivalent independent verification standard
gOGig's GPS + geofence + dwell-time + AI coverage verification works across every mobile activation format running across multiple Indian cities.
gOGig's multi-city van verification runs across every major Indian metro and tier-1/tier-2 city where sampling, canter, and LED van campaigns are deployed.
Replace distance reports with verified multi-city coverage
Free 14-day Field Execution Intelligence pilot for FMCG, D2C, healthcare, BFSI, EdTech, and automotive brands running sampling van or canter / LED van / mobile demo campaigns. Live GPS + geofenced activation zones, dwell time verification, live sampling proof capture, AI coverage intelligence, real-time multi-city dashboard, per-van scorecards. 100% verification accuracy. 100% fraud detection rate.
100%
AI accuracy
100%
Detection rate
4-15x
Year-1 ROI
Written by
gOGig Editorial Team
The gOGig Editorial team publishes research, frameworks, and field intelligence drawn from gOGig Labs' dataset of 10,000+ verified field submissions across FMCG, OOH, BTL, pharma, security, and BFSI sectors.
Was this article helpful?
Your feedback helps us write better content.