How do I detect when a vendor reuses the same pole board photo across locations?
2 min read

A 5-layer operational playbook for India's ₹20 to 25 lakh Cr FMCG sector. Built for brand managers, trade marketing heads, and sales operations leaders running campaigns across 13 million retail outlets, 4 distribution tiers, and 3 million field reps.
9.5%
Share of FMCG companies globally that can monitor trade promotions in-flight and reallocate spend in real time. The remaining 90% operate without live execution visibility, exposing thousands of crores annually in trade spend leakage.
A senior trade marketing manager at a top-5 Indian FMCG brand opens her Monday review. Last quarter's POSM activation across 2,400 stores. Compliance reported at 94%. Footfall plausibility intact on paper. Sales team in tier-3 markets reporting fewer shelf placements than the audit shows. Six weeks have passed since the campaign closed. The accountability gap is now structural across Indian FMCG.
| Distribution layer | Share of FMCG distribution | Outlet count | Verification maturity |
|---|---|---|---|
| General Trade (kirana, chemist, wholesale) | 75% | 12 to 13 million | Low |
| Modern Trade (chain retail) | 14 to 16% | 40,000 to 60,000 stores | Medium (retailer-driven) |
| E-commerce + Quick Commerce | 8 to 10% | Platform-bound | High (platform-native) |
| HoReCa, institutional, B2B | 2 to 3% | Variable | Low to medium |
| Workforce category | Approximate strength (India) | Daily activity scale |
|---|---|---|
| FMCG sales representatives | 3 million | 30 to 60 outlets per rep per day |
| Distributor salesmen | 1.2 to 1.5 million | 40 to 80 stores per day |
| Merchandisers and shelf auditors | 200,000 to 300,000 | 15 to 25 outlets per day |
| In-store promoters (modern trade) | 150,000 to 200,000 | 1 store per shift |
| Trade scheme verification auditors | 30,000 to 50,000 | 20 to 30 stores per day |
| Field marketing activation crews | 80,000 to 120,000 | 1 to 3 sites per day |
| Direct-to-retailer field force | 40,000 to 60,000 | 15 to 25 retailers per day |
Live field visibility
Geo-fenced attendance, live movement trails, real-time outlet coverage, beat plan adherence, GPS plus sensor cross-check. Replaces end-of-day reporting with submission-level real-time data.
Fraud detection infrastructure
9-layer mock-location detection, EXIF preservation, image hash uniqueness, OTP-validated retailer onboarding, duplicate proof flagging. Catches ghost visits, fake retailer entries, and inflated incentive claims at submission.
Execution-to-commerce intelligence
Links shelf visibility, promoter activity, POSM compliance, and trade scheme execution with secondary sales and stock movement. Converts execution data into market share signal.
Real-time decision infrastructure
Mid-campaign reallocation, anomaly inbox, vendor-level scorecards, regional trend detection. Built for a market where rural grew 8.4% while urban grew 2.6% in some quarters.
CFO-grade accountability
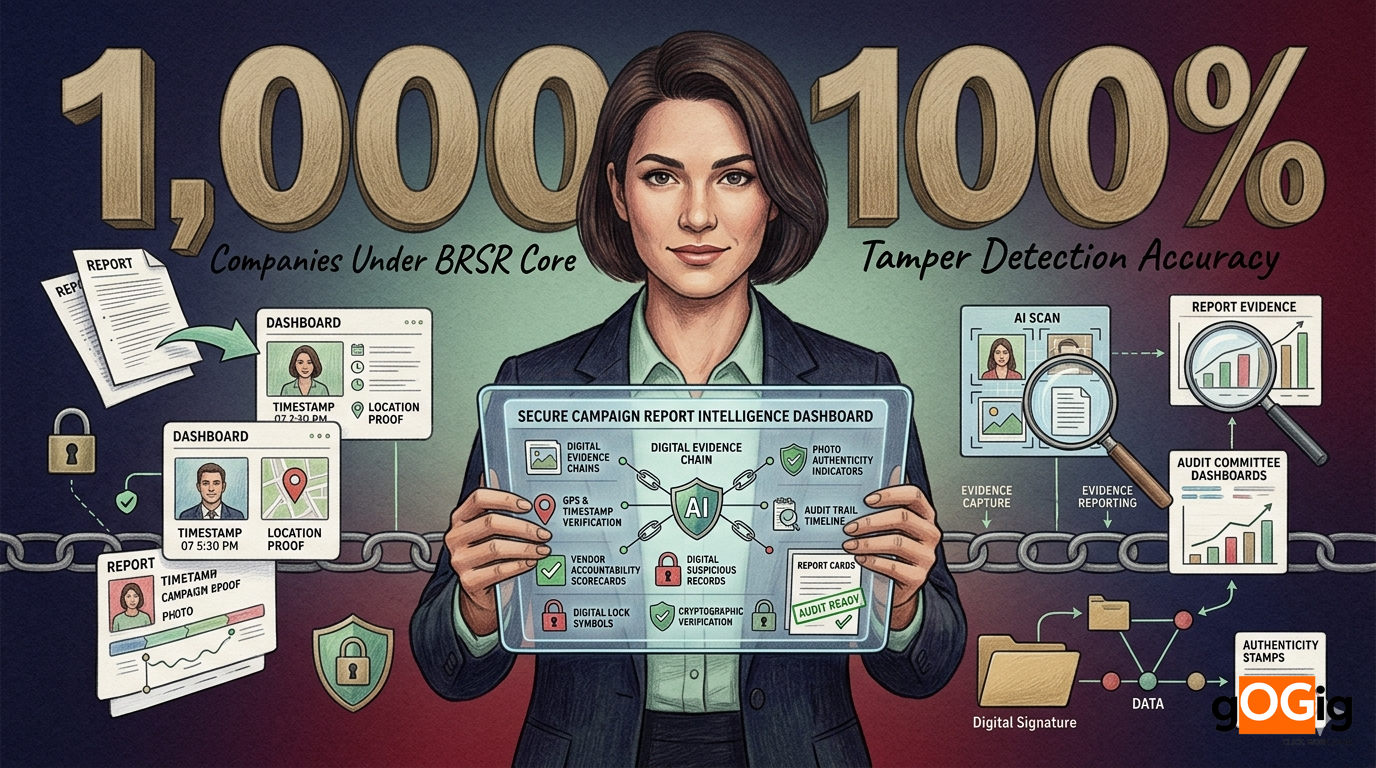
Verified execution rate as quarterly KPI, 3-way matching ready, BRSR Core aligned, 7-year audit trail. Brings BTL spend to the same governance standard as IT, capex, and logistics.
| KPI | What it measures | Industry benchmark |
|---|---|---|
| Compliance rate | % of stores meeting execution standards | 78 to 88% (top 100 FMCG) |
| Numeric distribution | % of stores stocking each SKU | 60 to 92% by category |
| Weighted distribution | % of category sales reached | 75 to 95% |
| Share of shelf (SoS) | Brand facings vs total facings | 15 to 35% in core categories |
| POSM presence | % of stores with branded POSM live | 62 to 78% (general trade) |
| Out-of-stock (OOS) rate | % of priority SKUs missing | 8 to 15% typical |
| Planogram compliance | % of shelves matching mandate | 55 to 75% (general trade), 80 to 92% (modern trade) |
| Perfect store score | Composite KPI combining 8 to 12 factors | 45 to 65% average |
| Beat plan adherence | % of planned outlets visited per rep | 72 to 88% |
| Productive call rate | % of visits resulting in order | 50 to 75% |
| KPI | Self-reported (typical) | FEI-verified (typical) | Gap |
|---|---|---|---|
| POSM compliance | 92 to 96% | 72 to 80% | 15 to 22 pts |
| Numeric distribution | 88 to 94% | 76 to 84% | 10 to 14 pts |
| Planogram compliance | 85 to 92% | 62 to 74% | 20 to 24 pts |
| Beat plan adherence | 90 to 96% | 74 to 82% | 14 to 18 pts |
| Productive call rate | 78 to 84% | 58 to 68% | 16 to 20 pts |
| Perfect store score | 62 to 70% | 45 to 55% | 15 to 17 pts |
Ghost store visits
Sales rep marks an outlet visited without entering. Geo-fence and sensor cross-check expose the gap when added.
01
Pattern
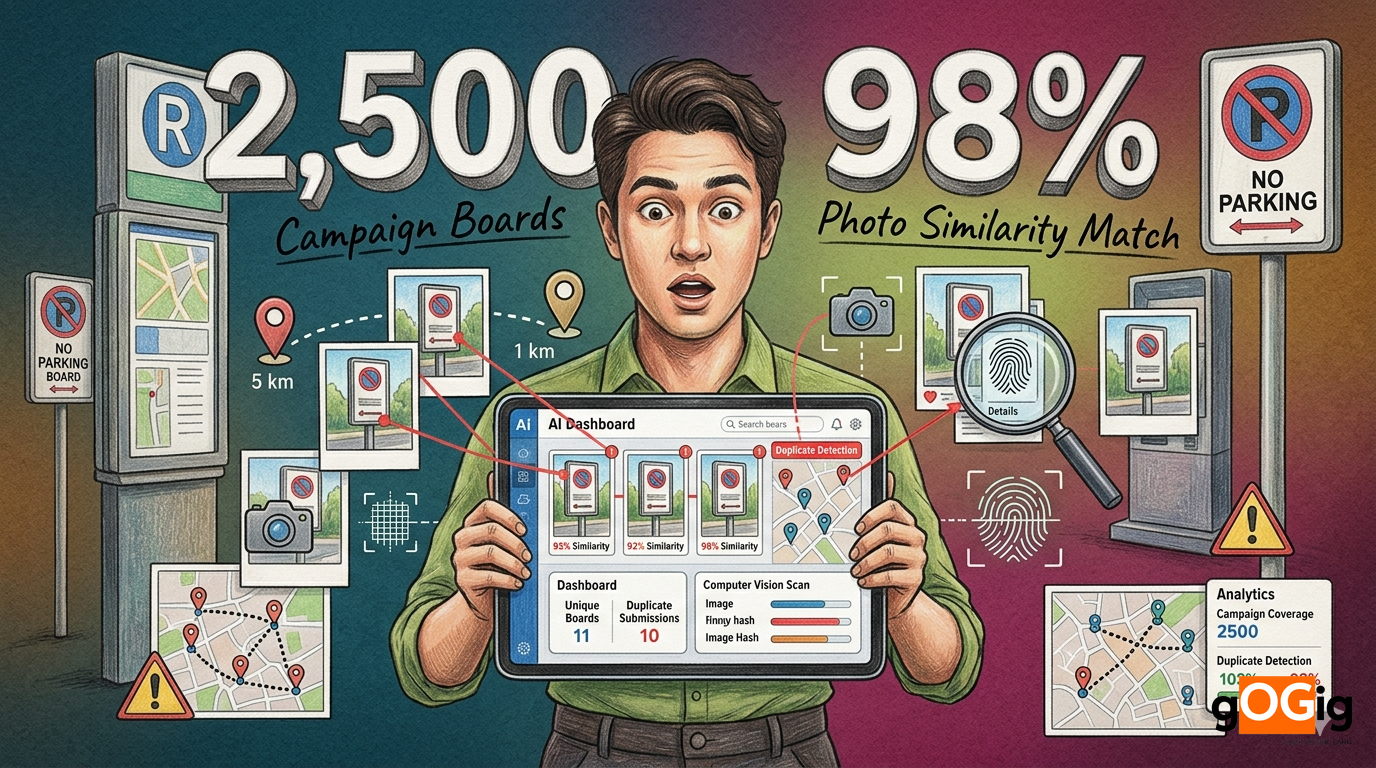
Recycled POSM photos
Same POSM photo submitted across multiple stores under different captions. Image hash uniqueness catches the duplication.
02
Pattern
Fake retailer onboarding
Fictitious retailers added to capture onboarding incentives. OTP plus geo plus shop name board verification eliminates the path.
03
Pattern
Inflated trade scheme claims
Distributors report higher scheme deployment than executed. Audit reconciliation against verified outlet visits surfaces the gap.
04
Pattern
Promoter share-shifting
One promoter checks in across two adjacent stores using shared device. Face match plus per-device fingerprint blocks the pattern.
05
Pattern
Planogram photo staging
Shelf rearranged for the audit photo, restored afterward. Repeat audits with anomaly clustering expose recurring offenders.
06
Pattern
Mobile van route skipping
Sampling van skips contracted stops, batch reports late evening. Continuous capture plus route compliance flags missing stops.
07
Pattern
Sampling stock inflation
Samples reported distributed are unaccounted in stock reconciliation. Outlet-by-outlet sample drop verification closes the loop.
08
Pattern
Activation duration shortening
Promoter activation runs 2 hours of contracted 4. Continuous selfie plus sensor capture verifies actual duration.
09
Pattern
Geo-spoofed retail visibility audits
Auditor submits visit data from home using mock-location apps. 9-layer detection architecture catches 99%+ of attempts.
10
Pattern
| FMCG category | Typical BTL + trade spend | Leakage range | Annual exposure |
|---|---|---|---|
| Personal care | 2.8 to 4.5% of revenue | 14 to 20% | ₹120 to 280 Cr per large brand |
| Home and laundry | 2.5 to 4.0% | 12 to 18% | ₹95 to 220 Cr per large brand |
| Food and beverage | 3.0 to 5.5% | 14 to 22% | ₹150 to 350 Cr per large brand |
| Snacks and confectionery | 3.5 to 6.0% | 16 to 24% | ₹95 to 220 Cr per large brand |
| Hot beverages (tea, coffee) | 2.8 to 4.2% | 13 to 18% | ₹80 to 180 Cr per large brand |
| Dairy | 2.0 to 3.5% | 10 to 16% | ₹70 to 150 Cr per large brand |
| Oral care | 3.2 to 5.0% | 15 to 22% | ₹65 to 140 Cr per large brand |
| Skin and hair care | 4.0 to 6.5% | 16 to 24% | ₹110 to 240 Cr per large brand |
| Baby care | 3.5 to 5.5% | 14 to 20% | ₹55 to 120 Cr per large brand |
| Health and OTC | 2.5 to 4.0% | 12 to 18% | ₹60 to 130 Cr per large brand |
| Execution dimension | General Trade (Kirana) | Modern Trade (chains) |
|---|---|---|
| Share of FMCG distribution | 75% | 14 to 16% |
| Outlet count | 12 to 13 million | 40,000 to 60,000 |
| Audit focus | 5 to 10 priority SKUs per category | Full primary plus secondary plus POSM |
| Time per outlet | 4 to 8 minutes per visit | 30 to 60 minutes per audit |
| Visibility risk | Owner-discretion shelf placement | Planogram contracted |
| OOS occurrence | 12 to 18% | 4 to 8% |
| Verification approach | Sales rep capture + image recognition | Dedicated merchandiser audit |
| POSM compliance baseline | 62 to 78% | 82 to 94% |
| Trade scheme complexity | High (per-distributor variation) | Low (chain-level contract) |
| Fraud risk concentration | Ghost visits, fake retailers | Planogram staging, duration inflation |
| One-size-fits-all failure mode | Outcome |
|---|---|
| Full audit checklist applied to GT | Sales rep time inflated, beat plan collapses |
| GT-style 5-SKU audit applied to MT | Missed secondary display tracking, contract breach undetected |
| Same verification cadence for both | MT under-served, GT over-served |
| Same image recognition model | GT shelves chaotic, MT planograms structured. Models trained on one fail on the other |
| Same incentive structure for promoters | MT promoters game shift hours, GT reps game beat plan |
| Same data refresh cycle | MT needs hourly, GT needs daily. Same cadence wastes capacity |
| POSM lifecycle stage | Common failure mode | FEI verification |
|---|---|---|
| Production and logistics | POSM units lost in transit | Vendor receipt verification |
| Distribution to field | Materials sitting in distributor godown | Distributor inventory check-in |
| Outlet placement | Stored in shop backroom, never displayed | Photo capture at point of installation |
| Display duration | Removed within 2 to 5 days | Repeat audit cadence per outlet |
| Damage and replacement | Damaged POSM not flagged | Image recognition quality check |
| Competitor obstruction | Competitor POSM placed in front | Share of visibility scoring |
| End-of-campaign removal | Outdated POSM left in market | Closure audit cycle |
| Reconciliation against billing | Mismatch between POSM units billed and verified | 3-way match report |
Run a free FMCG campaign audit
Bring us one live FMCG campaign across 50 to 200 outlets. We deploy the 5-layer FEI stack and return a vendor-level, city-level, SKU-level audit within 14 days. Free, no setup required for field teams.
Request a free FMCG audit →| Trade scheme type | Typical % of FMCG trade spend | Verification gap |
|---|---|---|
| Off-invoice discount | 30 to 40% | Distributor pass-through to retailer unclear |
| Volume rebates (slab-based) | 15 to 22% | Sell-out tracking absent or delayed |
| POSM and visibility spend | 12 to 18% | Outlet-level placement unverified |
| Sampling and consumer activation | 8 to 14% | Sample drop reconciliation weak |
| Promoter and merchandising | 7 to 12% | Attendance plus duration self-reported |
| Retailer loyalty schemes | 5 to 10% | Earn-burn tracking inconsistent |
| Display and category schemes | 4 to 8% | Planogram compliance unverified |
| New product introduction (NPI) trade | 3 to 6% | Outlet onboarding and shelving inconsistent |
| Dimension | Urban FMCG | Rural FMCG |
|---|---|---|
| Demand growth (2024-25) | 2.6% | 8.4% |
| Share of FMCG demand | 62 to 64% | 36 to 38% |
| Outlet density per 10,000 people | 22 to 35 | 12 to 18 |
| Average outlet revenue | ₹35,000 to 1.2L per month | ₹8,000 to 25,000 per month |
| Distributor coverage gap | 15 to 22% | 30 to 45% |
| POSM compliance baseline | 72 to 82% | 54 to 65% |
| Ghost visit fraud rate | 4 to 8% | 12 to 20% |
| Mock-location prevalence | 5 to 9% | 15 to 22% |
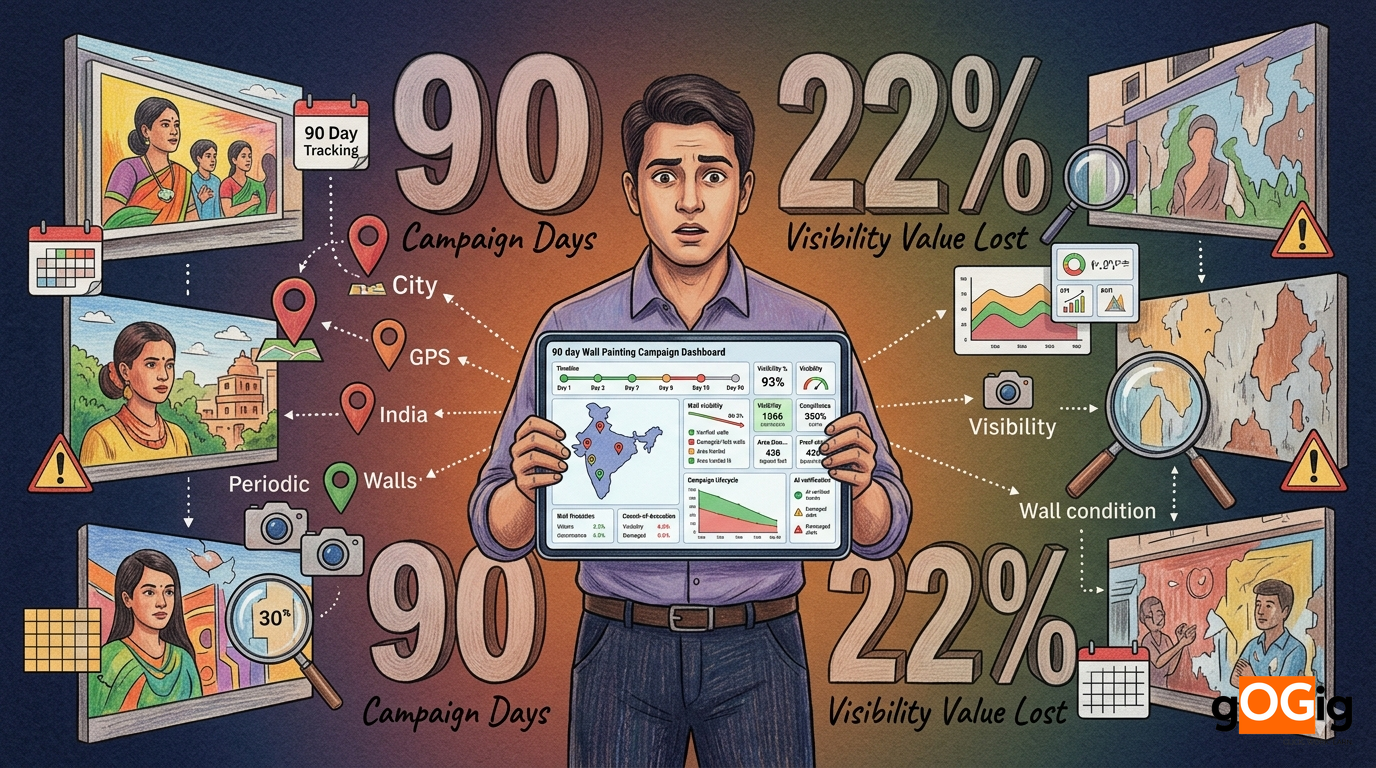
| Wall painting share of BTL | 3 to 8% | 22 to 32% |
| Verification ROI multiplier | 3 to 5x | 5 to 9x |
| Quick commerce impact | Implication for FMCG execution |
|---|---|
| Q-commerce share rising to 8 to 12% of urban FMCG | SKU prioritisation shifts to top 50 from top 200 |
| 10-minute delivery expectation | Stock-out tolerance collapses |
| Dark store density increasing | Modern trade outlet hierarchy fragmenting |
| Q-commerce verification fully digital | GT and MT verification gap becomes more visible |
| Real-time inventory by Q-commerce | Sets new baseline for what brands expect from GT and MT |
| Q-commerce algorithmic shelf placement | Brand can no longer negotiate shelf as in physical |
| Q-commerce share of voice attribution | Brands learn to attribute spend in real time |
| Pressure on GT and MT verification standards | FEI becomes the parity capability |
| Sales force metric | Pre-FEI baseline | Post-FEI (12 months) |
|---|---|---|
| Beat plan adherence | 72 to 82% | 88 to 96% |
| Productive call rate | 50 to 65% | 68 to 80% |
| Outlet coverage per rep per day | 32 to 45 | 40 to 55 |
| Order capture per visit | 52 to 68% | 70 to 82% |
| Numeric distribution growth (annual) | 3 to 6% | 8 to 14% |
| Time spent on reporting per rep per day | 45 to 60 minutes | 10 to 18 minutes |
| Time spent on selling per rep per day | 4.5 to 5.5 hours | 6.5 to 7 hours |
| Field attrition rate | 32 to 45% annually | 22 to 32% |
| Vendor cost per verified outlet visit | ₹85 to 140 | ₹38 to 65 |
| Image recognition capability | What it produces | Indian FMCG adoption (2026) |
|---|---|---|
| SKU detection on shelf | Numeric distribution validation | Top 50 brands |
| Share of shelf measurement | Competitive intensity score | Top 30 brands |
| Planogram compliance scoring | 0 to 100 compliance grade per outlet | Top 40 brands |
| POSM detection and damage assessment | POSM presence and quality score | Top 60 brands |
| Price compliance (MRP, promo) | Price tag recognition | Top 25 brands |
| Out-of-stock detection | Empty facing identification | Top 50 brands |
| Competitor activity flagging | Competitor SKU visibility tracking | Top 35 brands |
| Photo authenticity detection | Stock photo, recycled photo, AI-generated photo flagging | Early adopters only |
| Trade promotion outcome | Pre-FEI | Post-FEI (steady state) |
|---|---|---|
| Promotion compliance rate | 62 to 75% | 88 to 94% |
| Promotion-to-sales lift attribution | Anecdotal | Quantified per outlet |
| Trade spend ROI | 1.4 to 2.2x | 2.5 to 4.0x |
| Mid-campaign reallocation feasible | Rare | Weekly cycle |
| Bottom 20% promotion identification | End of cycle | Within 14 days |
| Distributor scheme dispute volume | 22 to 32% of submissions | 4 to 8% |
| Trade margin leakage | 14 to 22% | 3 to 7% |
| NPI outlet rollout speed | 8 to 14 weeks to numeric distribution target | 4 to 8 weeks |
| CFO question | Pre-FEI answer | Post-FEI answer |
|---|---|---|
| What is our verified trade spend execution rate? | Unknown | Quantified per quarter, per region, per SKU |
| What is our annual trade promotion leakage? | Anecdotal | Quantified in rupees |
| Are our distributor claims reconcilable? | Manual, partial | Automated 3-way matching |
| What is our POSM execution rate? | Agency-reported | Independently verified |
| Can we substantiate value chain for BRSR Core? | No | Yes, 7-year retention |
| What is our ghost visit prevalence? | Unknown | Quantified per vendor, per geography |
| What is our cost per verified outlet touch? | Aggregated only | Per-visit precision |
| What is our true secondary sales attribution? | Sales team estimate | Verified execution to commerce data |
| Phase | Duration | Outcome |
|---|---|---|
| Discovery and scope alignment | Days 1 to 10 | Top 1 to 3 campaigns identified for pilot, KPIs locked |
| Vendor and distributor onboarding | Days 11 to 25 | Field force trained, WhatsApp workflow live |
| First verified submissions flow | Days 26 to 40 | Baseline data established, anomalies surface |
| Vendor-level breakdown shared | Days 41 to 50 | Gap distribution clarified, vendor conversations begin |
| Procurement and PBP clause adoption | Days 51 to 65 | Contracts upgraded with verified execution KPI |
| Mid-campaign reallocation exercise | Days 66 to 75 | First real-time spend rebalancing |
| Closeout reconciliation comparison | Days 76 to 85 | Side-by-side PPT vs FEI shared with CFO |
| Scale-out planning | Days 86 to 90 | Roadmap for 70 to 95% campaign coverage in next quarter |
| Line item | Pre-FEI | Year 1 of FEI |
|---|---|---|
| Annual trade plus BTL spend | ₹75 Cr | ₹75 Cr |
| Unverified portion (% of spend) | 22% | 9% |
| Unverified spend (rupees) | ₹16.5 Cr | ₹6.75 Cr |
| Recovered savings | -- | ₹9.75 Cr |
| Trade promotion ROI uplift | 1.8x baseline | 2.7x baseline |
| Productive call rate uplift | -- | +14 percentage points |
| Numeric distribution gain | -- | +6 percentage points |
| Platform cost (12 months) | -- | ₹1.4 Cr |
| Net P&L impact (Year 1) | -- | +₹8.35 Cr |
| Net ROI multiplier | -- | 6.0x |
India's FMCG sector does not need better campaign tracking software. It needs an operational intelligence layer for the physical economy. Verified execution becomes the operating standard once a brand stops accepting trust-based reporting.
Legacy FMCG reporting stack
WhatsApp photos, Excel reconciliation, supervisor approvals, end-of-month PPT, agency closeout decks. 22 to 30% leakage absorbed as execution noise. 90% of brands cannot reallocate trade spend in flight. POSM compliance reported at 94%, verified at 72%.
FEI execution stack
9-layer verification, real-time dashboards, anomaly inbox, vendor scorecards, OTP-validated retailer onboarding, image recognition for shelf and POSM, 3-way matching automation, BRSR Core ready 7-year audit trail. Leakage drops to 4 to 9%. Trade spend ROI doubles within 12 months.
Run a free FMCG campaign audit
Bring us one live FMCG campaign across 50 to 200 outlets. We deploy the 5-layer FEI stack and return a vendor-level, city-level, SKU-level audit within 14 days. Free, no setup required for field teams.
14–22%
Avg trade spend leak
4–8x
Year-1 ROI
14 days
Onboarding time
Written by
gOGig Editorial
gOGig Editorial covers platform education, field execution intelligence, and trade marketing for India's physical economy.
Was this article helpful?
Your feedback helps us write better content.