Single-vendor vs multi-vendor BTL campaign management: 2026 decision framework
2 min read

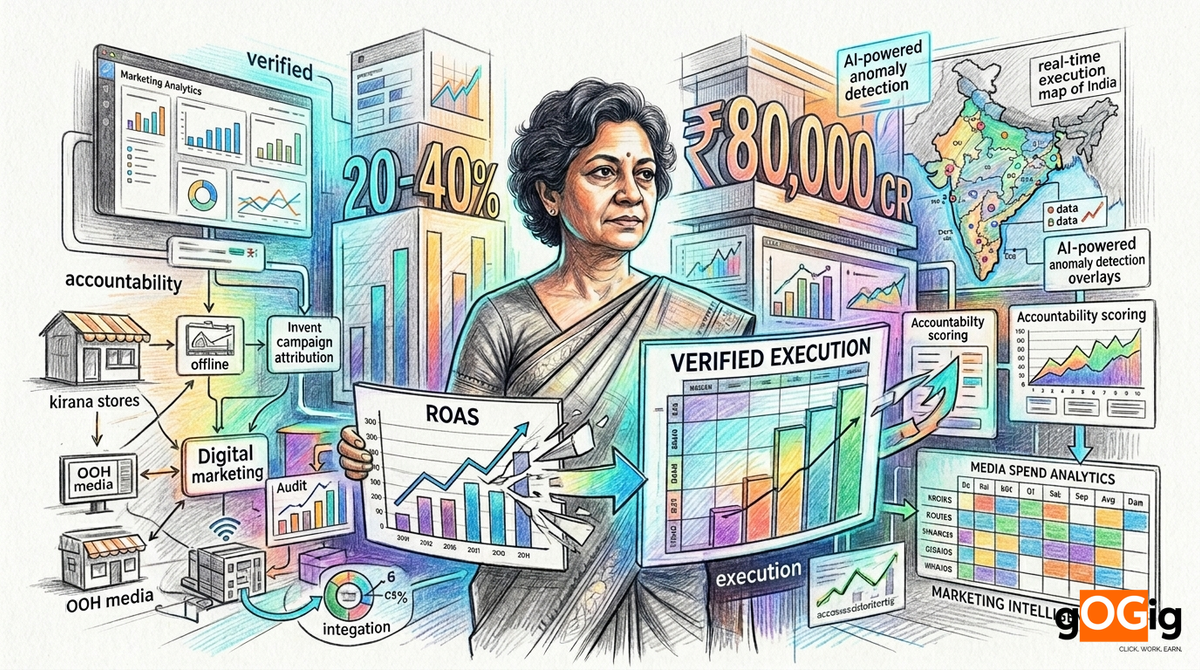
A category-framing analysis of why Return on Ad Spend alone no longer satisfies India's CMO mandate. The next KPI is Return on Verified Execution. Built for marketing leaders, brand custodians, and CMOs who answer to CFOs and audit committees for thousands of crores in marketing spend.
20 to 40%
Share of attributed conversions in last-click ROAS models that would have happened anyway, according to incrementality testing research. The implication is structural. True ROAS is often half of reported ROAS, and that is before execution authenticity is even considered.
A CMO at a top-25 Indian listed company opens the quarterly board pack. ROAS is 4.2:1, up from 3.6:1. Attribution dashboards are clean. CAC is trending favorably. The CFO turns the page and asks one question. Of the ₹40 Cr we spent on field activations and OOH last quarter, what percentage is independently verifiable. The room goes silent. The CMO realises the dashboard answered everything except the question the CFO actually asked.
| Question the dashboard answers | Question the CMO needs to answer |
|---|---|
| How many impressions did we generate? | How many of those impressions were verifiable? |
| What was our ROAS? | What was our Return on Verified Execution? |
| What was our CAC? | What was our verified CAC after spend leakage adjustment? |
| How many leads did we capture? | How many leads were OTP-validated? |
| What was our attribution mix? | What is our exposure if audit committee tests substantiation? |
| How efficient is our media spend? | What can we defend in a SEBI BRSR Core assurance review? |
| Did we hit footfall targets? | Were footfall claims plausibility-checked? |
| How many BTL activations ran? | How many activations were independently verified? |
ROAS optimises for media efficiency. It does not measure execution authenticity. In a country where ₹80,000 Cr of physical marketing runs on trust-based reporting, that is the gap that defines the next CMO mandate.
| What ROAS measures well | What ROAS does not measure |
|---|---|
| Revenue per rupee of digital ad spend | Execution authenticity of offline campaigns |
| Channel-level correlation to sales | Whether the activation actually happened |
| Last-click attribution efficiency | Whether vendor billing matches verified delivery |
| Comparative media efficiency | Whether OOH hoardings were physically up |
| Conversion rate optimisation | Whether retail POSM was actually installed |
| Brand-versus-non-brand split | Whether promoter attendance was real |
| Funnel velocity | Whether trade scheme compliance was authentic |
| Channel-mix optimisation | Whether audit committees can defend spend |
| CAC payback period | BRSR Core value chain substantiation |
| Lifetime value cohort tracking | RBI, SEBI, NFRA inspection-readiness |
Did the campaign actually happen the way we paid for it?
ROAS dashboards rarely answer this. Agency PPTs claim 96% compliance. Independent verification typically shows 72 to 84%.
Was the execution independently verifiable?
Self-reported execution by the executing party is not verification. Without an independent layer, every ROI number rests on an unverified base.
Were the leads we counted actually real?
Lead capture without OTP validation has 22 to 38% fabrication rates in some BFSI and education segments. Conversion math built on unvalidated leads is structurally inflated.
Did our vendors deliver what we paid for?
3-way matching covers IT, capex, and logistics by default. BTL, OOH, field force, and trade schemes are typically exempt. The exemption is where the leakage lives.
Can we defend this spend to our audit committee?
For listed companies under BRSR Core (top 250 from FY 2025-26), the audit committee is no longer hypothetical. Limited assurance requires evidence-grade documentation.
What is our exposure if the regulator asks?
SEBI BRSR Core, RBI FPC, IRDAI mis-selling regulations, FSSAI for QSR, NFRA audit oversight. The regulatory perimeter is expanding faster than most CMO dashboards.
If we cut 30% of this spend tomorrow, what would we actually lose?
Without verified execution baseline, the CMO cannot defend the budget. The CFO who asks this question will get the cut by default.
| Metric | Definition | How it differs from ROAS |
|---|---|---|
| ROAS | Attributed revenue divided by ad spend | Measures media efficiency assuming execution happened |
| iROAS (incremental ROAS) | Causal revenue lift divided by ad spend | Adjusts for organic baseline; still assumes execution |
| Verified Execution Rate (VER) | % of contracted execution independently verified | Measures what actually happened on the ground |
| RoVE | Attributed revenue divided by verified spend only | Combines media efficiency with execution authenticity |
| RoVE-adjusted CAC | CAC calculated only on verified leads and verified spend | Removes phantom efficiency from media math |
| Verified payback period | Time to LTV recovery on verified customer acquisition | Eliminates bias from unverified lead inflation |
| Reporting dimension | ROAS-only view | RoVE-adjusted view |
|---|---|---|
| Spend deployed | ₹10 Cr | ₹10 Cr |
| Reported ROAS | 4.2:1 | 4.2:1 |
| Execution verified | Not measured | 76% verified, 24% unverified |
| Verified spend | -- | ₹7.6 Cr |
| Actual return on verified spend | -- | 5.5:1 on verified, 0 on unverified |
| Effective campaign ROI | 4.2:1 (assumed) | 3.2:1 (real, after leakage) |
| Leakage | Invisible | ₹2.4 Cr quantified |
| CFO confidence | Notional | Defensible |
| Metric | Why it belongs on the CMO dashboard |
|---|---|
| Marketing-attributed revenue | Top-line accountability to revenue |
| Blended CAC and verified CAC | Honest cost of acquisition after spend leakage |
| Channel-level ROAS | Media efficiency by channel |
| Verified Execution Rate (VER) | % of physical marketing independently verified |
| Return on Verified Execution (RoVE) | The combined efficiency-plus-authenticity number |
| Funnel conversion by stage | Quality of demand generation |
| Pipeline velocity | Speed of conversion |
| Audit-grade evidence readiness | Defensibility to CFO, audit committee, and regulator |
Add Field Execution Accountability to your dashboard
Bring one BTL, OOH, or field activation campaign for a 14-day pilot. We deploy the FEI verification stack and return a Verified Execution Rate report alongside your existing ROAS metrics. Free, no setup required for field teams.
Request an accountability audit →| Marketing activity | ROAS dashboard sees | Reality on the ground |
|---|---|---|
| BTL field activation | Campaign executed nationally | 62 to 78% activations actually compliant |
| OOH hoarding deployment | 500 sites delivered | 14 to 22% with installation, illumination, or duration gaps |
| Retail POSM rollout | Pan-India coverage achieved | 22 to 32% with previous campaign still displayed |
| Promoter deployment | 5,000 promoter hours logged | 62 to 75% productive promoter time verified |
| Lead generation events | 840 leads captured | 540 OTP-validated |
| Trade scheme rollouts | All distributors active | 14 to 22% trade margin leakage |
| Mall and society activations | 60,000 footfall achieved | Footfall plausibility rarely checked |
| Influencer activations | 5M impressions delivered | Bot fraud and engagement inflation widespread |
| Sampling drives | 60,000 samples distributed | Per-outlet sample reconciliation gaps |
| Wall painting and rural BTL | Coverage met | 22 to 32% dimension or location substitution |
| Boardroom stakeholder | Question being asked in 2026 |
|---|---|
| CEO | Is our marketing spend producing verifiable business outcomes? |
| CFO | What % of our marketing line is substantiable? |
| Chief Risk Officer | What is our exposure on third-party execution claims? |
| Head of Internal Audit | Can we close the recurring marketing controls finding? |
| Audit Committee Chair | What is our position for BRSR Core limited assurance? |
| Head of Procurement | Is our BTL spend in 3-way matching? |
| Investor relations | How do we answer ESG analyst questions on value chain? |
| ESG officer | Can we substantiate vendor and supplier governance? |
| CMO deliverable | Closes which boardroom question |
|---|---|
| Verified Execution Rate by campaign | CEO substantiation question |
| Per-campaign verified spend report | CFO substantiability |
| Vendor-level scorecards | CRO third-party exposure |
| 7-year audit trail | Internal audit findings closure |
| BRSR Core value chain pack | Audit committee limited assurance |
| 3-way matching reports for BTL | Procurement integration |
| Marketing substantiability narrative | Investor and ESG analyst questions |
| Independent verification evidence | ESG officer value chain disclosure |
| Regulatory force | Effective period | CMO implication |
|---|---|---|
| SEBI BRSR Core (top 250 listed) | FY 2025-26 mandatory | Value chain disclosure on vendor execution |
| SEBI BRSR Core (top 500 listed) | FY 2026-27 | Expanded mandate |
| SEBI BRSR Core (top 1,000 listed) | FY 2027-28 | Industry-wide standard |
| NFRA tightening audit scrutiny | Continuous | External auditor questions on marketing controls |
| DPDP Act 2023 | In force | Customer consent for every marketing interaction |
| RBI 2026 Loan Recovery Rules (draft) | July 2026 expected | BFSI marketing field force compliance |
| RBI Digital Lending Guidelines | In force | Third-party marketing partner monitoring |
| IRDAI mis-selling regulations | In force | Insurance marketing field verification |
| FSSAI for QSR | In force | Outlet-level execution evidence |
| UCPMP for pharma marketing | In force | Sample distribution and HCP engagement evidence |
Activity-led CMO
Measures effort and reach. ROAS, impressions, CTR, attendance, attribution dashboards. Strong on media. Blind on execution authenticity. Cannot answer audit committee questions on spend substantiability.
Outcome-led CMO
Measures business impact. Revenue contribution, pipeline velocity, CAC, LTV. Stronger CFO alignment. Still treats execution as a black box. Vulnerable to BRSR Core assurance failures.
Accountability-led CMO
Measures outcomes plus execution authenticity. Verified Execution Rate, Return on Verified Execution, RoVE-adjusted CAC, audit-grade evidence. Closes audit committee findings. Defends spend with substantiable data. The new CMO mandate.
| Maturity stage | Share of Indian CMOs | Trajectory |
|---|---|---|
| Stage 1 (Activity-led) | ~52% | Declining |
| Stage 2 (Outcome-led) | ~38% | Stable to slightly growing |
| Stage 3 (Accountability-led) | ~10% | Growing fastest |
| Digital marketing instinct | Why it fails offline |
|---|---|
| Platform reports are sufficient evidence | BTL platforms do not have universal data feeds |
| Last-click attribution captures outcomes | Physical activations have no equivalent attribution layer |
| Vendor pixels track everything | BTL vendor activity is mostly invisible to digital tools |
| A/B testing is the experimentation standard | Field workforce variability makes A/B testing inconclusive |
| Performance marketing optimises automatically | BTL needs human-grade execution discipline |
| Fraud detection is built into platforms | BTL fraud detection is not built in anywhere by default |
| Real-time dashboards are universal | BTL dashboards arrive 2 to 3 weeks after campaign close |
| Spend can be paused mid-campaign | BTL spend is mostly committed before execution begins |
| Brand revenue range | Typical BTL+OOH+trade spend | Annual leak at 22% gap | Year-1 recovery with FEI |
|---|---|---|---|
| ₹500 to 1,000 Cr | ₹15 to 35 Cr | ₹3 to 8 Cr | ₹2 to 5 Cr |
| ₹1,000 to 2,500 Cr | ₹35 to 95 Cr | ₹8 to 21 Cr | ₹5 to 14 Cr |
| ₹2,500 to 5,000 Cr | ₹95 to 220 Cr | ₹21 to 48 Cr | ₹14 to 32 Cr |
| ₹5,000 to 10,000 Cr | ₹220 to 480 Cr | ₹48 to 105 Cr | ₹32 to 70 Cr |
| ₹10,000 to 25,000 Cr | ₹480 to 1,200 Cr | ₹105 to 264 Cr | ₹70 to 175 Cr |
| Top-10 Indian companies (₹25,000 Cr+) | ₹1,200 Cr+ | ₹264 Cr+ | ₹175 Cr+ |
Legacy campaign report
"Campaign delivered 60,000 footfall across 12 cities. POSM compliance 96%. ROAS 4.2:1. Sentiment positive. Vendor billing reconciled. Closeout PPT shared in 18 days." Reads well. Cannot be independently substantiated. Audit committee findings recur.
Verified execution report
"Verified footfall plausibility 84%. POSM independently verified at 74%. RoVE 3.4:1 on verified spend, 0:1 on unverified. Vendor scorecards generated. ₹6.2 Cr of ₹40 Cr spend verified as substantiable for BRSR Core. 7-year audit trail accessible on demand." Less flattering on paper. Defensible in every audit conversation.
In 2026, the question is no longer how many people saw the campaign. The question is whether the campaign actually happened the way it was paid for. That single shift is what separates the CMO mandate of the next decade from the one that defined the last one.
| What CFO needs from CMO | What CMO needs from CFO |
|---|---|
| Verified Execution Rate as quarterly KPI | Investment in verification infrastructure |
| RoVE on top of ROAS in board reports | Recognition that accountability is structural, not a tool |
| 3-way matching readiness for BTL spend | Procurement support for PBP clause adoption |
| BRSR Core value chain disclosure pack | Time horizon: 12 to 18 months for full embed |
| Vendor-level performance scorecards | Acknowledgement that some vendors will fail and need replacement |
| Audit-grade evidence on demand | Audit committee narrative alignment |
| RoVE-adjusted CAC for annual planning | Patience during the 90-day pilot phase |
| Clear marketing accountability scorecard | Budget protection during transition |
| Phase | Duration | Outcome |
|---|---|---|
| Pilot scope and KPI alignment | Days 1 to 10 | Top 2 to 3 campaigns selected, Verified Execution Rate locked as KPI |
| FEI deployment on pilot campaigns | Days 11 to 30 | Real-time verification dashboard live |
| First Verified Execution Rate report | Days 31 to 45 | Quantified baseline gap visible to CMO and CFO |
| Vendor and agency communication | Days 46 to 60 | Pushback distribution informs vendor classification |
| Procurement and contract upgrades | Days 61 to 75 | PBP clauses added to renewals |
| Audit committee evidence package | Days 76 to 85 | First substantiable marketing spend report shared |
| Dashboard transition to RoVE-led | Day 86 onward | New CMO scorecard adopted across reviews |
| Scale-out planning | Day 91 onward | Roadmap to 70 to 95% campaign verification coverage |
| Metric | Baseline | Year 1 | Year 3 |
|---|---|---|---|
| Verified Execution Rate (BTL plus OOH) | 62 to 78% | 84 to 92% | 94 to 97% |
| RoVE vs ROAS gap | 20 to 30% | 10 to 15% | 3 to 7% |
| Audit committee findings on marketing | 3 to 5 open | 1 to 2 open | 0 open |
| BRSR Core readiness | None | 78% of campaigns | 96% of campaigns |
| BTL spend in 3-way match | 0 to 15% | 50 to 70% | 92 to 97% |
| Verified CAC vs reported CAC gap | 22 to 32% | 9 to 14% | 3 to 6% |
| Press coverage citing accountability | Rare | Emerging | Default expectation |
| Investor questions on marketing substantiation | Occasional | Quarterly | Continuous |
| Driver of CMO accountability adoption | Time horizon |
|---|---|
| BRSR Core regulatory clock | Through FY 2027-28 |
| CFO and audit committee pressure rising | Quarterly and continuous |
| Procurement governance maturity | 12 to 18 months for full embed |
| Investor pressure on substantiation | Continuous, rising |
| Press positioning shift | 2026 to 2027 |
| Agency competitive positioning | 12 to 18 months |
| Peer-brand category leadership | Early-adopter visibility |
| Industry analyst coverage | 2027 to 2028 |
Add Field Execution Accountability to your dashboard
Bring one BTL, OOH, or field activation campaign for a 14-day pilot. We deploy the FEI verification stack and return a Verified Execution Rate report alongside your existing ROAS metrics. Free, no setup required for field teams.
22–30%
Avg gap (reported vs verified)
4–8x
Year-1 ROI
14 days
Onboarding time
Written by
gOGig Research Team
A category-framing analysis of why Return on Ad Spend alone no longer satisfies India's CMO mandate. The next KPI is Return on Verified Execution. Built for marketing leaders, brand custodians, and CMOs who answer to CFOs and audit committees for thousands of crores in marketing spend.
Was this article helpful?
Your feedback helps us write better content.