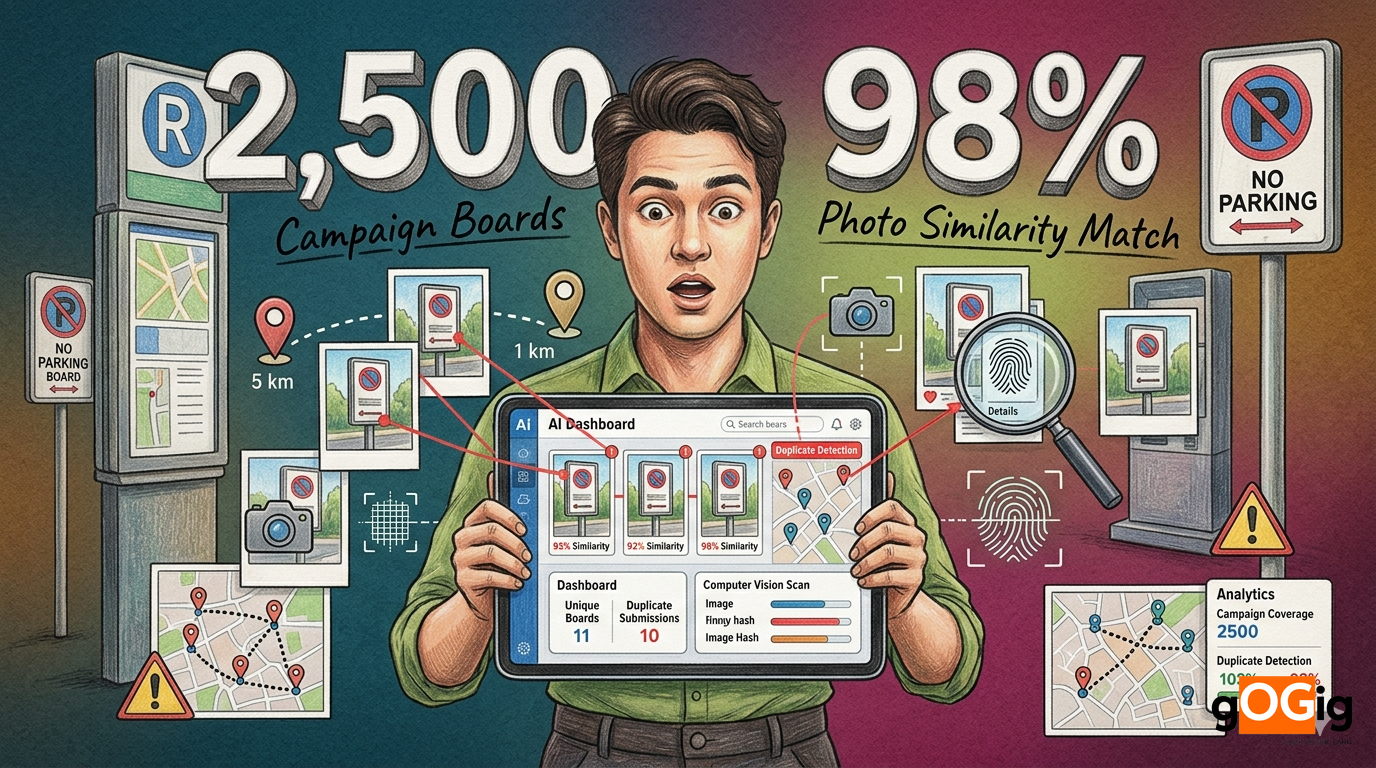
How do I detect when a vendor reuses the same pole board photo across locations?
2 min read

For twenty years, digital marketers have known exactly what works. Every click, every impression, every conversion logged in real time. The ₹80,000 crore Indian physical economy has waited a generation for the same accountability layer. The wait ends here.
21 years
The gap between when digital marketing got its accountability layer (Google Analytics, 2005) and when India's physical economy began getting its equivalent (2026).
Imagine a CMO who runs digital and BTL with the same budget envelope. Every Monday she opens the digital dashboard and knows precisely how many impressions, clicks, conversions, and rupees of pipeline her digital spend produced last week. The same Monday, she opens the BTL report and reads a sentence written by an agency, citing photographs taken by a vendor, summarising activity she has no way to independently confirm. Same CMO. Same week. Same budget. Two entirely different relationships with the truth.
Digital marketing did not always have analytics. The accountability infrastructure that today's CMO takes for granted was built deliberately, by specific companies, over a specific timeline. Below is the history that the physical economy has not had.
1995
Urchin Software Corporation founded
The first commercial web analytics platform begins development in San Diego. The core product would later become Google Analytics. The first proof-of-engagement layer for the digital channel is in motion.
2005
Google launches Google Analytics
Google acquires Urchin in April 2005 and launches Google Analytics free to the public in November 2005. Within one week, demand exceeds capacity. Within six months, web analytics moves from a $500-per-month enterprise service to a default expectation for every website. The democratisation of digital accountability begins.
2009 to 2012
Event tracking, real-time analytics, tag manager
Real-time analytics launches in 2011, letting marketers see what is happening on their websites at the exact moment it happens. Event tracking, tag management, and conversion attribution become standard.
2014
Universal Analytics goes live
Cross-device tracking. Multi-platform views. The first ten years of digital accountability infrastructure consolidate into a unified standard.
2020
GA4 launches with event-based, AI-driven model
The next generation of digital analytics arrives. Machine learning-driven attribution. Predictive metrics. The platform that originally tracked sessions now tracks individual user events across an integrated journey.
2023
Universal Analytics retired
The digital marketing world is fully native to event-based, AI-augmented measurement. CMOs running digital have twenty years of accountability infrastructure behind every decision.
2026
Field Execution Intelligence arrives in India
The first generation of accountability infrastructure for India's ₹80,000 crore physical economy launches. Geo-locked capture, time-locked submission, AI verification, real-time dashboards. The twenty-year asymmetry ends.
The most useful way to grasp the asymmetry is to compare the two channels across the operating metrics that define them. Below is the audit, dimension by dimension.
| Dimension | Digital marketing | Physical economy |
|---|---|---|
| Spend in India 2026 | ~₹35,000 Cr digital ad spend | ~₹80,000 Cr BTL + OOH + field force |
| Third-party measurement | Google Analytics, Adobe, MMP platforms | None until 2026 |
| Real-time visibility | Yes, since 2011 | No, photos arrive at end of campaign |
| Verified delivery | Pixel fires, server-side events | Vendor self-report in WhatsApp groups |
| Audit trail | Persistent, exportable, queryable | Excel sheets, photo folders, PDFs |
| Course correction window | Same day or same hour | 4 to 8 weeks after campaign closes |
| Standard reporting unit | Conversion, ROAS, attribution | "Activations completed" (binary) |
| Anomaly detection | Automated bot/fraud filtering | Manual spot checks if any |
| CFO defensibility | Auditable per channel | Photo proof, no integrity guarantee |
| Industry analyst coverage | Gartner, Forrester, IDC | Beginning to emerge in 2026 |
Ten dimensions. Digital has infrastructure for every single one. The physical economy has had nothing on nine of them, and the tenth (industry analyst coverage) is only just beginning to form. The asymmetry is not subtle.
See your physical economy data through a digital marketing lens
Run one BTL campaign with full verification. Compare what the agency reported to what actually happened. The same gap that digital analytics surfaced in 2005 is now visible for the physical economy.
Open the BTL Leak Calculator →The clearest way to see the asymmetry is to ask the same question in both channels and watch the answers diverge.
Digital
Yes. The pixel fired. The server logged the event. The conversion attribution traces a verified path from impression to outcome. Audit trail by default.
Physical economy until 2026
A photograph submitted by the executor was sent. The brand has no independent way to confirm whether the activation occurred at the scale, location, or duration contracted.
Digital
Server-side timestamps logged at the moment of the event. Visible in real-time dashboards within seconds. Cannot be backdated, modified, or fabricated.
Physical economy until 2026
Whatever the agency reports. Photo timestamps can be edited. Reports are compiled days after the event. No independent verification of the date claimed.
Digital
IP geolocation, device geolocation, GPS metadata, and behavioural patterns triangulate location to the city level for nearly all events, neighbourhood level for many.
Physical economy until 2026
The location written in the agency's deck. No independent geo-verification. Mock-location apps can spoof GPS data. No EXIF integrity check on submitted photos.
Digital
Exact event counts. Exact impression counts. Exact click counts. The platform itself is the source of truth, deduplicated automatically by user identity.
Physical economy until 2026
'5,000 units distributed' reported by the same team that handled the distribution. The same pole board photographed from five angles becomes five reported installations. No automated duplicate detection.
Digital
Conversion attribution. Pipeline contribution. Revenue tracked back to the impression that started the journey. CFO sees ROAS at channel level, audit committee sees attribution methodology.
Physical economy until 2026
'Campaign successful' reported in the post-mortem. No causal link between activation and downstream sales. Outcome attribution is essentially aspirational.
There are five structural reasons the accountability layer arrived late for the physical economy. Each one held back the category for years. All five have now been resolved.
The technology did not exist at scale
In 2005, GPS in mobile phones was rare in India. Smartphone penetration was less than 1%. Building a real-time geo-verified accountability layer for the physical economy was not technically possible at the consumer device level.
Field teams resisted any digital adoption
Hundreds of thousands of promoters, painters, surveyors, and salespeople across India had no incentive and limited ability to install or learn a new app. Every previous attempt at field tracking failed at this adoption barrier.
The cost of verification exceeded the leak
Sending third-party audit teams to 200 villages cost more than the inflation those audits would catch. The math of accountability did not favour the truth. Brands rationalised the loss as the cost of doing business in India.
No category vocabulary existed
There was no 'Google Analytics for physical execution' because there was no recognised category called 'physical execution analytics.' Without the category vocabulary, neither buyers nor builders could articulate what they were building or buying.
CFOs were not in the marketing accountability room
Until SEBI's BRSR framework began requiring value chain disclosure, marketing accountability sat entirely with the CMO. The buying conversation for verification infrastructure did not have the financial gravity it needed to drive enterprise adoption.
All five barriers above have been resolved in the past 24 months, in three converging shifts. The convergence is what makes Field Execution Intelligence the inevitable category of this decade for the Indian physical economy.
WhatsApp penetration crossed the threshold
India crossed 500 million WhatsApp users. Field teams across every Indian state already use the app daily. Verification platforms built as WhatsApp workflows removed the adoption friction that killed every previous attempt at field tracking. No new app to install. No new behaviour to learn.
AI verification became economically viable
Image fingerprinting, EXIF anomaly detection, GPS validation, and clustering pattern analysis run at fractions of a rupee per submission. The marginal cost of verifying one more execution event dropped near zero. Verification at scale became commercially feasible for the first time.
CFOs entered the marketing accountability conversation
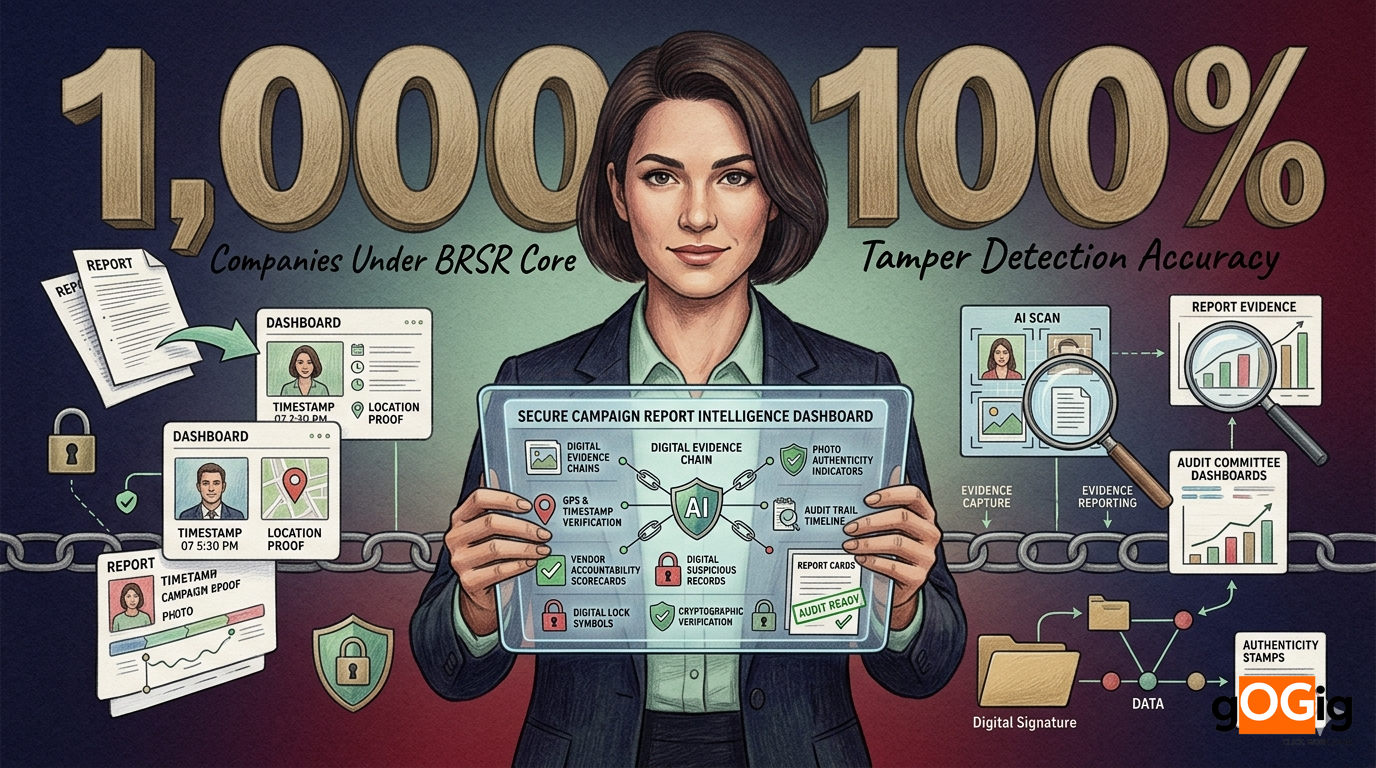
SEBI's BRSR Core framework and value chain disclosure requirements made unverified marketing spend a governance issue. Audit committees now flag BTL audit trails. CFOs treat verification as a financial control, not a marketing tool.
Field Execution Intelligence is the category that brings the digital marketing accountability standard to the physical economy. The capabilities map directly onto the digital analytics stack that took twenty years to build, compressed into a unified Indian-first platform.
Geo-locked capture
Every execution event tagged with verified GPS coordinates at the moment of submission. The physical economy's equivalent of IP geolocation in digital.
Time-locked submission
Server-side timestamps that cannot be backdated. The physical economy's equivalent of pixel-fire timestamps in digital.
AI verification at submission
Duplicate detection, EXIF integrity, route reconstruction, and anomaly flagging. The physical economy's equivalent of bot detection and fraud filtering in digital.
Real-time accountability dashboard
Execution visible as it happens, not weeks after. The physical economy's equivalent of real-time analytics that digital got in 2011.
Multi-format unification
Wall painting, mobile vans, pole boards, retail audits, sales visits, technician installs, security patrols in one data model. The physical economy's equivalent of cross-channel attribution.
Audit-grade reporting
Verification trails that survive regulatory scrutiny and CFO-level demand. The physical economy's equivalent of audit-ready conversion reports for BRSR.
Every capability digital marketing built over twenty years now has a direct equivalent for the physical economy. The same accountability discipline. The same data integrity. The same audit defensibility. Compressed into the platform that India's BTL, OOH, field force, and trade activation ecosystem needs.
The compounding moment for a CMO is when both the digital and physical sides of the marketing portfolio operate with the same accountability discipline. The decisions that follow from that state are different from any decisions made under the old asymmetry.
Quarterly board reviews include execution verification rate alongside ROAS
Channel allocation decisions are made on comparable accountability data, not just intuition
CFOs receive consistent audit trails across digital and physical channels
Procurement contracts include Proof Before Payment clauses across all vendor types
Marketing teams stop having to defend BTL spend in different vocabulary from digital spend
ESG and BRSR disclosures for marketing value chain become substantiable end to end
Strategic decisions on tier-2 and tier-3 market expansion run on verified coverage data
The CMO and CFO speak the same language for the first time in twenty years
For two decades, marketing teams treated digital as the channel that "worked" and physical as the channel that "performed." The difference was never the channel. The difference was the data.
The accountability shift looks different by industry because the physical spend mix differs. Below is what the new Field Execution Intelligence layer means across the categories with the highest physical economy exposure.
FMCG & consumer goods
Trade promotions, sampling, retail visibility, merchandiser audits all become verified at the unit level. Trade strategy stops running on inflated outlet databases. Sales attribution can finally include verified field activation data.
25–30%
Pharma field force
Medical rep visits become geo-verified and time-locked. Daily call reports stop being self-declarations and become accountability records. Doctor coverage data stops being aspirational.
15–20%
OOH media companies
Every installation becomes verifiable at the unit level. Client-facing proof of execution moves from photo decks to audit-grade evidence. Billing disputes drop sharply.
10–15%
QSR & multi-outlet retail
Monthly visual merchandising audits across hundreds of outlets become real-time. Compliance gaps surface within hours, not weeks. The format that needed verification first now gets it first.
8–12%
BFSI field operations
Door-to-door sales, branch visibility checks, lead generation activations all gain audit-grade trails. Regulatory pressure already pushing the verification standard from above.
8–12%
Real estate & construction
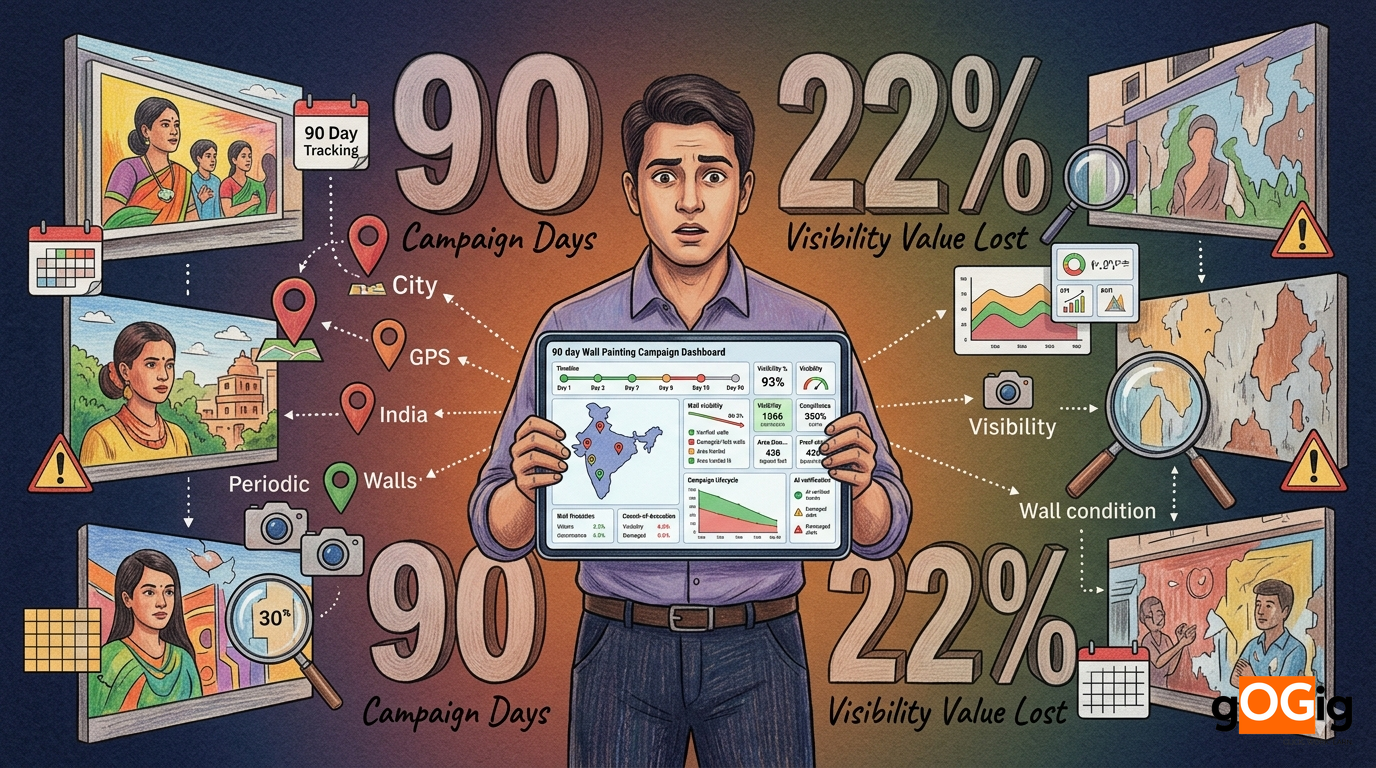
Hoardings, society activations, no-parking boards during launches finally get unit-level verification. Night installation fraud, historically invisible, becomes detectable.
5–10%
India is the largest physical economy in the world that has been operating without accountability infrastructure. That makes India the most consequential market for Field Execution Intelligence to land in, and the most natural starting point for the global category.
| Indicator | India | Implication |
|---|---|---|
| Physical economy spend | ₹80,000+ Cr annually | Larger than most peer emerging markets combined |
| WhatsApp penetration | 500M+ users | Highest adoption platform globally for field workforce |
| Informal retail share | 85% of FMCG | 13 million kirana outlets require accountability the global retail tools cannot serve |
| Field force scale | 12,000+ pharma reps per major brand | Scale that no global field service platform was built for |
| BRSR Core framework | Mandatory for top 1,000 listed companies | Regulatory pressure on marketing value chain accountability that no other emerging market has |
| Agency density | Thousands of BTL agencies across 14+ tier-1 cities | Distribution moat for any India-native platform that wins agency partnerships |
The category will be defined in India and exported from India. The next decade of physical economy accountability infrastructure will be built by companies that learned to operate at Indian scale, in Indian distribution conditions, with Indian regulatory pressure.
The transition from no-analytics physical economy to verified Field Execution Intelligence does not require a full re-platforming. The sequence is staged, measurable, and reversible at each step.
Days 1–30: Pilot one campaign
Run one BTL campaign with full verification. Compare agency reports to platform-verified execution. The gap is the brand's specific accountability number.
Days 31–60: Build internal alignment
Present the pilot gap to CFO, procurement, and internal audit. Allocate verification budget for the next quarter against the documented number, not against an industry estimate.
Days 61–90: Update standard contracts
Add Proof Before Payment clauses to vendor contracts. Brief agencies on the new verification requirement. Onboard format by format, starting with the highest-leak categories.
Days 91–180: Embed in operating standard
Verification becomes default for every new campaign. Reporting frameworks update to include verified execution rates alongside ROAS in board reviews.
100% of new BTL campaigns running with full verification by month 12
Documented accountability gap reduced by 50–70% from the pilot baseline
CFO receiving quarterly verified execution reports across the marketing portfolio
BRSR value chain disclosures supported by audit-grade evidence
Agencies competing on verification capability, not just on rate cards
Bring the digital marketing accountability standard to your physical economy spend
Run one campaign with full Field Execution Intelligence. See the same level of accountability data for BTL that you already have for digital. The asymmetry ends with one pilot.
₹80,000 Cr
Physical economy spend
20+
Years digital had analytics
0+
Years physical now has it
Written by
gOGig Research
gOGig Editorial Team
Was this article helpful?
Your feedback helps us write better content.